

Industrial Pump Selection Engineering Guide
A field-oriented engineering reference for industrial pump selection — from fluid behavior and corrosion to system curves, BEP, NPSH, operating regions, pump control, API requirements and practical selection decisions.
What Is Pump Selection?
Pump selection is a system-engineering decision: the selected pump must satisfy the hydraulic duty, liquid properties, suction conditions, mechanical limits, materials, driver, control philosophy, reliability target and project standard.
Flow and head alone are not a complete pump specification. A technically acceptable pump must also be checked at minimum, normal and maximum operating conditions and against the actual system curve.
A pump is not selected from a catalog by flow rate alone. The operating point is created by the interaction of the pump characteristic and the system characteristic. Selection therefore begins with the process and liquid, not with a pump model.
An ideal pump-selection program requires all six areas emphasized in the original Petropedam training presentation:
1. Conditions of Service
Normal/minimum/maximum duty, temperature, pressure, operating hours, start/stop and upset conditions.
2. Pump Specification
Hydraulic, mechanical, materials, sealing, driver, testing and documentation requirements.
3. Procurement
Vendor qualification, bid evaluation, quality surveillance and certified performance data.
4. Installation
Foundation, alignment, suction/discharge piping, strain control and commissioning.
5. Operation
Operating envelope, minimum flow, control philosophy, monitoring and abnormal-condition response.
6. Maintenance
Inspection, spares, repair strategy, condition monitoring and lifecycle support.
Critical concept from the original presentation: mistakes in procurement, installation, operation and maintenance can often be corrected later. Errors in Conditions of Service or Pump Specification propagate through every later stage and are much harder to recover.
The Engineering Selection Process
Data Required for Pump Selection
A complete process datasheet is the foundation. Below is a comprehensive checklist of essential parameters.
For chemically demanding services, Petropedam evaluates relevant major and trace constituents — including species such as halides and sulfides — together with concentration and temperature when they can influence material selection, corrosion, sealing or reliability.
| Parameter | Why It Matters | Typical Unit |
|---|---|---|
| Flow Rate (Normal / Min / Max) | Defines pump sizing; must cover operating range | m³/h |
| Total Dynamic Head | Sum of static, pressure, friction, and velocity head | m |
| Suction Pressure | Affects NPSHA and suction-specific speed | bar(a) or bar(g) |
| Discharge Pressure | Required to overcome system backpressure | bar(g) |
| Fluid Temperature | Affects vapor pressure, viscosity, material limits | °C |
| Specific Gravity (SG) / Relative Density | Converts pressure to head; affects power | — |
| Vapor Pressure | Required for NPSH calculation | bar(a) |
| Viscosity | Affects pump performance; corrections needed for centrifugal pumps | cSt |
| Rheological Characteristics | For non-Newtonian fluids; affects hydraulic design | — |
| Specific Heat (Cp) | Important when NPSHA is low | kJ/kg·K |
| pH (Acidity / Alkalinity) | Critical for material selection | — |
| Dissolved Gases / Aeration | Affects corrosion rate and pump performance | % |
| Suspended Solids | Causes erosion-corrosion; affects material selection | % or ppm |
| Allowable Leakage | Environmental and safety requirements; affects seal selection | — |
| NPSHA | Must exceed NPSHR with adequate margin | m |
| Operating Hours / Duty Cycle | Affects motor sizing, reliability, lifecycle cost | hrs/day |
| Applicable Standard | API 610, API 674, ISO 5199, NFPA 20, ANSI, API 676 | — |
Important: Trace constituents (halogens, halides, hydrogen compounds, sulfides) can have significant effects on pump materials even at very low concentrations. For example, fluorides affect high-silicon cast iron, and hydrogen sulfide affects various materials.
Fluid Properties — The Foundation of Pump Selection
Liquid properties can change pump type, curve correction, NPSH, materials, sealing, power and minimum-flow requirements. Use properties at the actual operating temperature — not only at ambient conditions.
Specific Gravity / Density
Head produced by a rotodynamic pump is approximately independent of density for a given speed and geometry, but pressure rise and shaft power change with density.
Vapor Pressure
Required for NPSHA. Vapor pressure must correspond to the actual liquid composition and worst credible temperature.
Viscosity
Viscosity can reduce rotodynamic flow, head and efficiency and change absorbed power. Correct water performance with a recognized method such as ANSI/HI 9.6.7 when applicable.
Rheology
Non-Newtonian fluids require a viscosity/rheology model over the expected shear-rate range; a single cSt value may be insufficient.
Temperature & Specific Heat
Affect viscosity, vapor pressure, material strength, sealing, thermal growth, temperature rise at low flow and NPSH.
Constituents & Solids
Major and trace constituents, gas content, particle size, hardness and concentration influence corrosion, erosion, plugging and material selection.
Critical Fluid Characteristics
- pH / chemical composition: evaluate at concentration and temperature, including trace halides, sulfides and other aggressive species.
- Suspended solids: define concentration, PSD, hardness, shape and settling tendency — not only a percentage.
- Free / entrained gas: can reduce developed head, efficiency and stability and may cause gas locking. Distinguish it from gas that remains dissolved and from vapor bubbles caused by cavitation.
- Allowable leakage / toxicity: may control the sealing concept and can justify dual seals, containment or sealless technology.
- Product sensitivity: contamination, shear, crystallization, polymerization or temperature limits may govern technology selection.
First understand the liquid. Then select pump materials.
Before using head and flow to size the pump, identify what the actual liquid can do to the casing, impeller, shaft, seals and elastomers. The following lesson restores the corrosion mechanisms and microstructure examples from the original Petropedam training presentation.
Why pump service differs from a static coupon: a material compatible in a low-velocity test can fail when local flow, impingement, solids, vapor-bubble collapse or a crevice repeatedly damages its protective film. The company training material makes this distinction central to pump material selection.
How an electrochemical cell damages a pump
Anodic regions lose metal to the electrolyte; a reduction reaction consumes electrons at cathodic regions. For a sustained galvanic couple there must be an electrolyte, anodic and cathodic areas, and an electronic path. These areas can occur on different connected parts or on microscopic regions of one material. A small anodic area coupled to a large cathodic area can lose thickness quickly.
Uniform / chemical attack
General loss can arise from chemical or electrochemical interaction with a liquid. Check temperature, concentration, exposure time and each wetted material. A single corrosion-rate figure does not establish fitness for the entire pump.
Galvanic corrosion
Inspect dissimilar wetted metals and the electrical contact between them: casing, impeller, fasteners and repairs. The small-anode / large-cathode geometry is particularly unfavorable in a conducting liquid.
Pitting and crevice attack
Deposits, gasket gaps and stagnant pockets can create a different local chemistry and oxygen supply. Ask about chlorides, oxidants, shutdowns and crevice geometry; a shallow average loss may conceal deep pits.
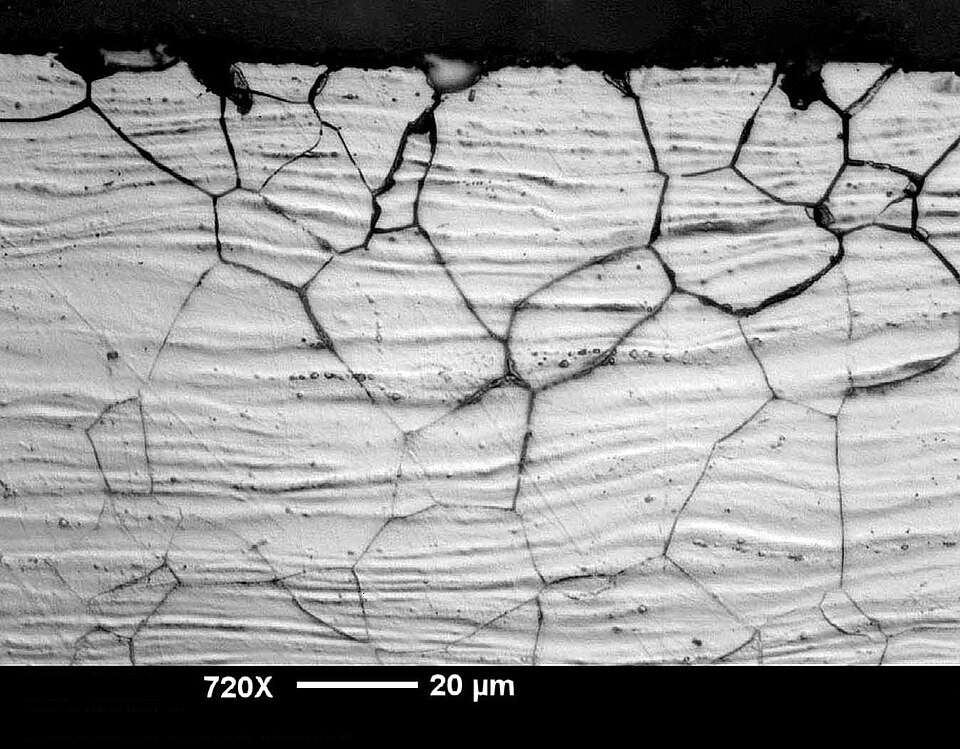
Intergranular corrosion
In susceptible stainless steels, heating or welding can precipitate chromium-rich carbides at grain boundaries, leaving adjacent regions chromium-depleted and vulnerable in certain media. Check the grade, carbon level, fabrication and heat-treatment history.
Dealloying / graphitic corrosion
The source calls this “graphitization”: selective attack of iron phases in gray cast iron leaves a weak graphite-rich skeleton even when the external shape appears intact. AMPP distinguishes the preferred term graphitic corrosion from metallurgical graphitization, the formation of graphite by carbide decomposition.
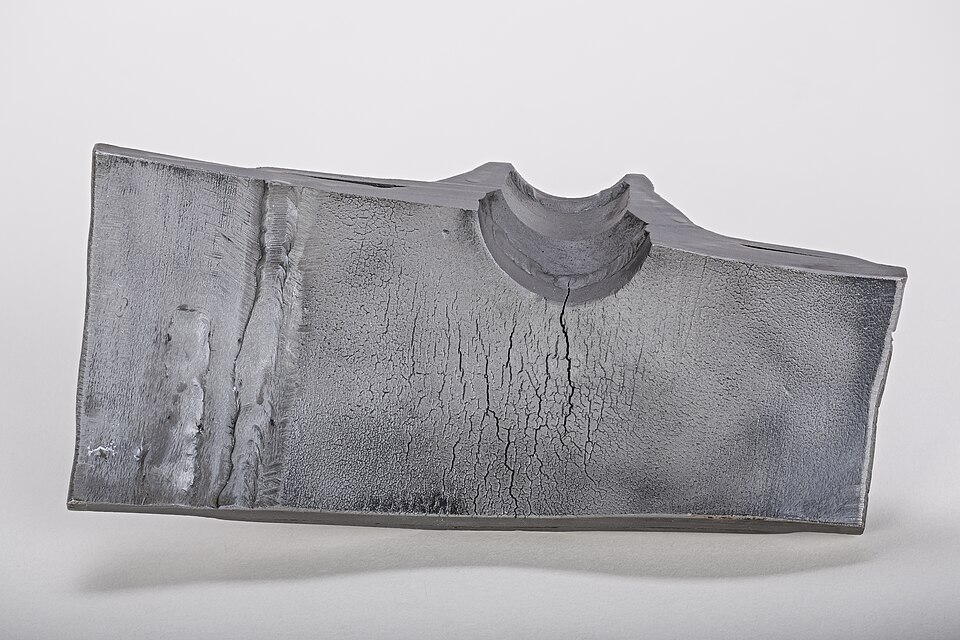
Stress-corrosion cracking (SCC)
A susceptible material under sustained tensile stress can crack in a particular environment, sometimes with little visible general thinning. Examine weld/residual stress, fluid chemistry, temperature and crack morphology; do not infer SCC from a surface crack alone.
Corrosion fatigue
Repeated shaft loading or pressure cycling in a corrosive environment can shorten fatigue life; a pit may become a crack-initiation site. Check load history, stresses, the medium and fracture features together.
Erosion–corrosion
Solids, high local velocity and impingement can strip corrosion products or passive films, exposing fresh metal. Consider impeller tips, bends, recirculation areas and startup/upset conditions.
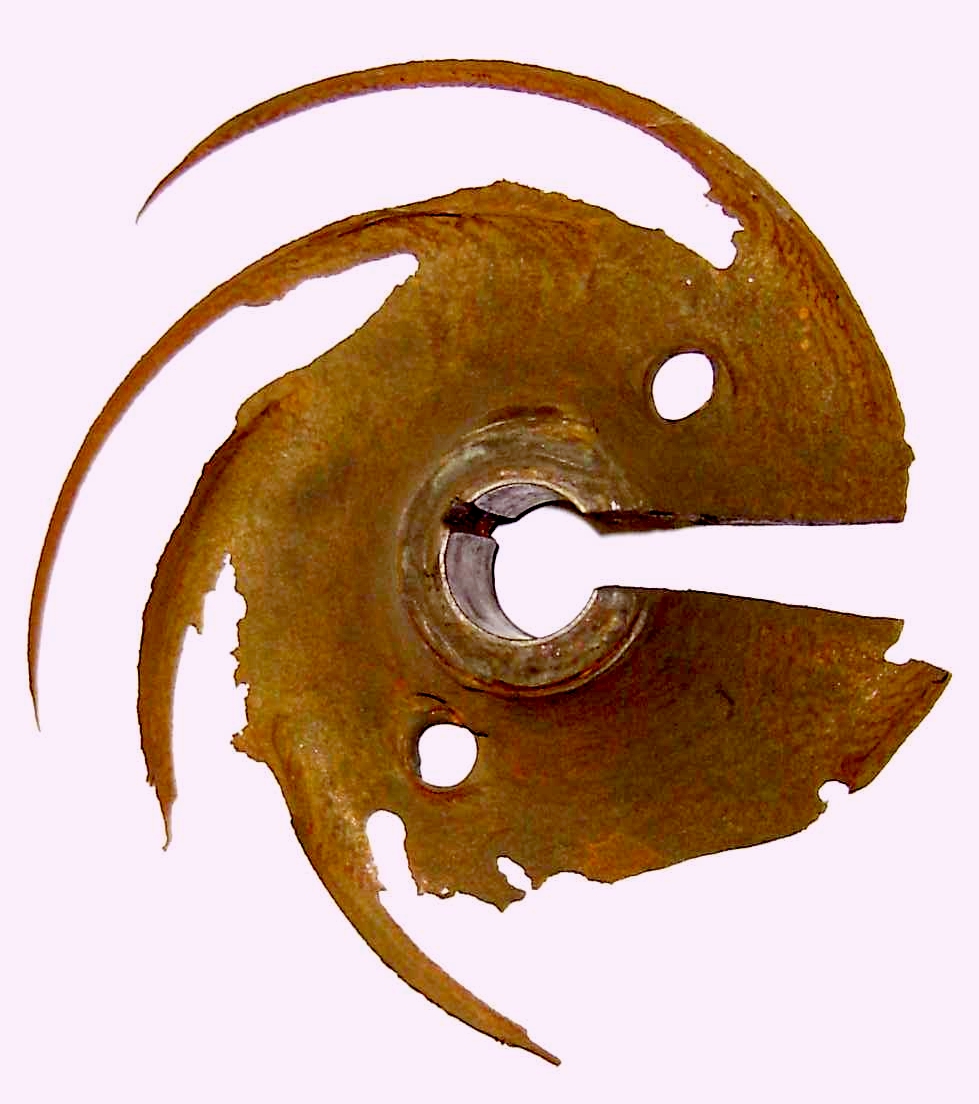
Microbiologically influenced corrosion
In wet or stagnant pump service, biofilm and deposits can change chemistry at the metal surface and contribute to localized attack. A pit or a green deposit does not prove a microbial cause: check deposits, water chemistry, microorganisms and the damage morphology together.
Cavitation erosion
Vapor bubbles formed at low local pressure collapse after moving into higher-pressure regions and can damage impellers. Check NPSH margin, suction conditions and operation before attributing metal loss to cavitation.
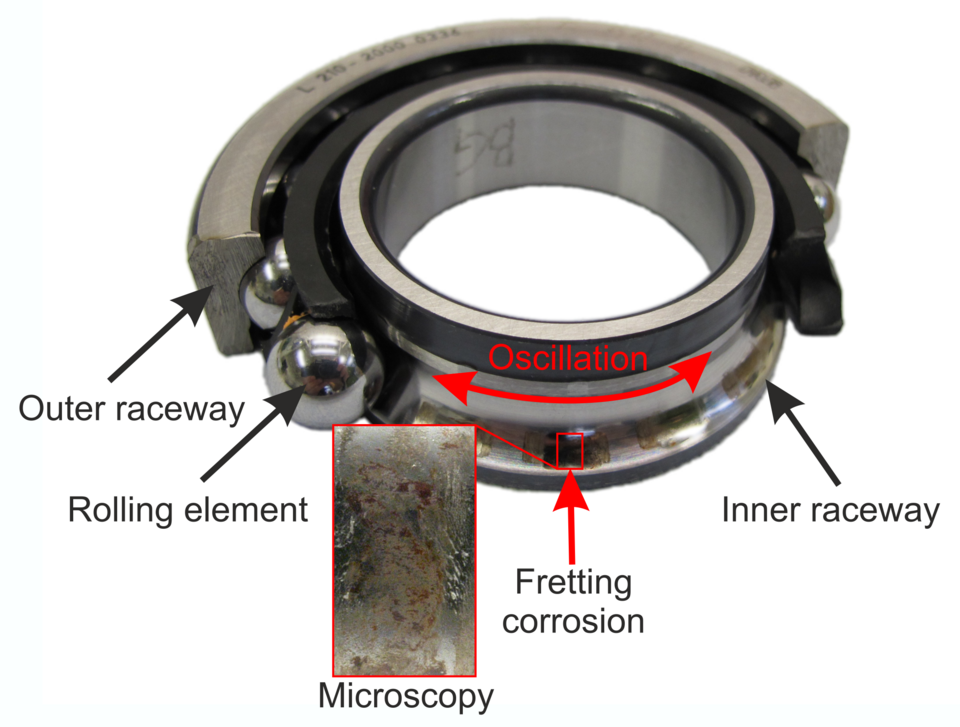
Fretting / fretting corrosion
Small oscillatory relative movement at a fitted shaft, bearing seat or fastener contact can remove surface material. Oxidation may accompany the wear, but micromotion itself does not require a liquid electrolyte. Examine contact fit, vibration and evidence of motion.
Local stress and strained-metal effects
The original teaching figures describe a “stress cell”: deformation or local residual stress may alter corrosion behavior at a notch or shaft shoulder. Stress alone does not prove that the site becomes anodic; evaluate film damage, material, liquid and loading. Distinguish this risk modifier from SCC and corrosion fatigue.
Dezincification of susceptible brass
The presentation also mentions selective leaching in copper-alloy components. In susceptible brass, zinc can be removed preferentially, leaving a porous copper-rich region with reduced strength. Identify the exact impeller or fitting alloy before applying this example; bronze alloys are not all brass.
Two microstructure lessons worth keeping
Chromium and iron are elements of the stainless alloy; merely having both does not create an inevitable corroding “Cr–Fe interface.” The issue illustrated in the original teaching figure is chromium depletion beside a grain boundary after carbide precipitation under susceptible thermal conditions. A separate microscopic example depicts a microscopic galvanic couple between phases in pearlitic iron. These are two different examples.
Each photograph and original teaching diagram is now directly below its corresponding mechanism. External photographs are attributed in their captions and do not establish the cause of damage in any specific customer pump.
From mechanisms to pump components: erosion and marine biofilms
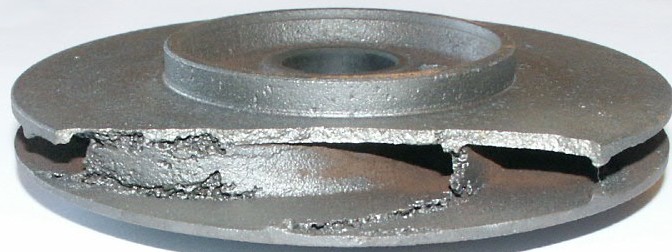
What the impeller photograph shows. The damaged blade edges above are an actual pump component. The image shows extensive metal loss but does not prove which share was caused by flow, particles, corrosion or cavitation, and its service liquid was not identified as seawater. For a documented seawater-pump repair example, see this separately identified seawater-pump case; the case photos are not used here.
How microbiologically influenced corrosion can arise in seawater service
During shutdown, low-flow or stagnant operation, a biofilm may accumulate in sheltered wetted regions, such as a casing recess, beneath deposits or near a gasket. Organisms and their metabolites can change local chemistry and oxygen availability, increasing the possibility of localized attack. Biofilm or pits alone do not prove MIC: evaluate the fluid, deposits, microbial evidence and corrosion morphology together.
The pump-casing illustration in the microbiologically influenced corrosion entry above points out the sheltered recess to inspect. Its colored deposit is a conceptual example, not a real pump sample or proof of microbial attack.
A documented seawater-pump repair case describes general corrosion in a cast-iron pump and galvanic attack at its wear rings; it does not claim MIC. The case photographs remain on the publisher's site and are linked here rather than reproduced.
Material availability, wetted construction and chemical duty
The training tables add a useful distinction: a material may be available in a pump construction without being compatible with a particular liquid. Availability, chemistry and mechanical loading must be checked separately.
Material availability by pump construction
A = Available. This source table records material availability by pump construction. A is not an A/B/C quality, suitability or corrosion-resistance grade. A dash means no entry was given in the source.
| Material | Chemical (ANSI) | Process (API) | Slurry | Between bearings / multistage / high speed |
|---|---|---|---|---|
| Carbon steel | — | A | — | — |
| Ductile iron | A | — | — | — |
| 316 stainless steel | A | A | — | A |
| Alloy 20 | A | A | — | A |
| CD4MCu | A | — | — | A |
| Hastelloy | A | — | — | — |
| Duplex alloys | A | — | — | — |
| Titanium | A | — | — | A |
| Zirconium | A | — | — | — |
| Silicon iron | A | — | — | — |
| Chrome iron | — | — | A | — |
| Rubber | — | — | A | — |
| Thermoplastic | A | — | — | — |
| Thermoset plastic | A | — | — | — |
| Glass | A | — | — | — |
| Ceramic | A | — | — | — |
| Graphite | A | — | — | — |
A means available in the historical source; a dash represents a blank original entry. These entries are not a current Petropedam product list, a certification statement or a chemical-compatibility rating. Specific grades and manufacturer availability must be confirmed. View original table.
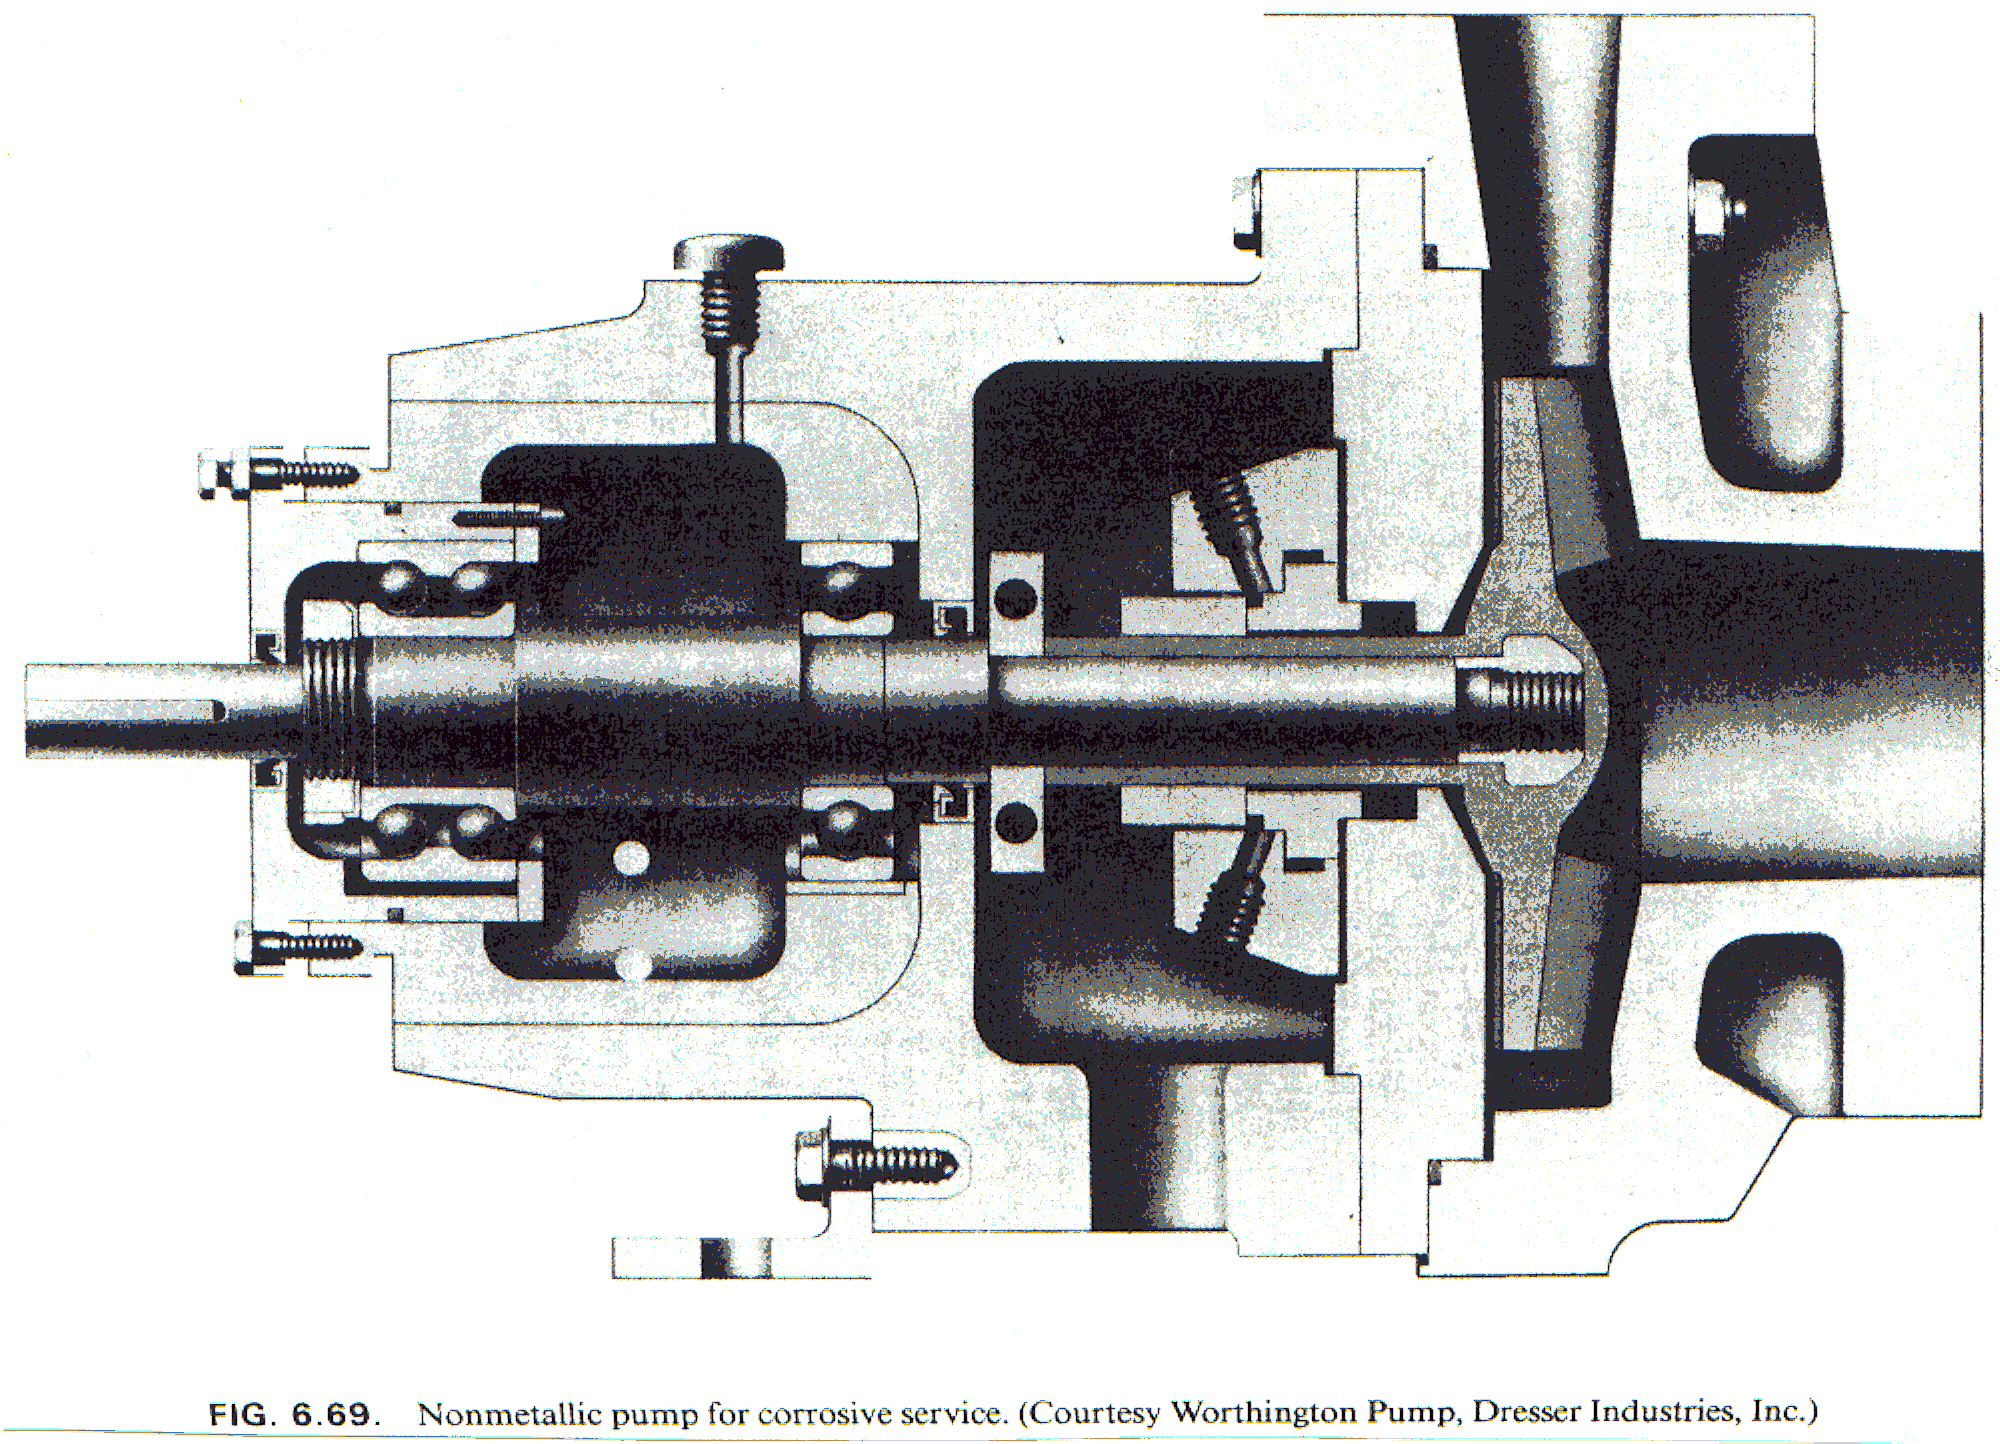
Nonmetallic pump for corrosive service
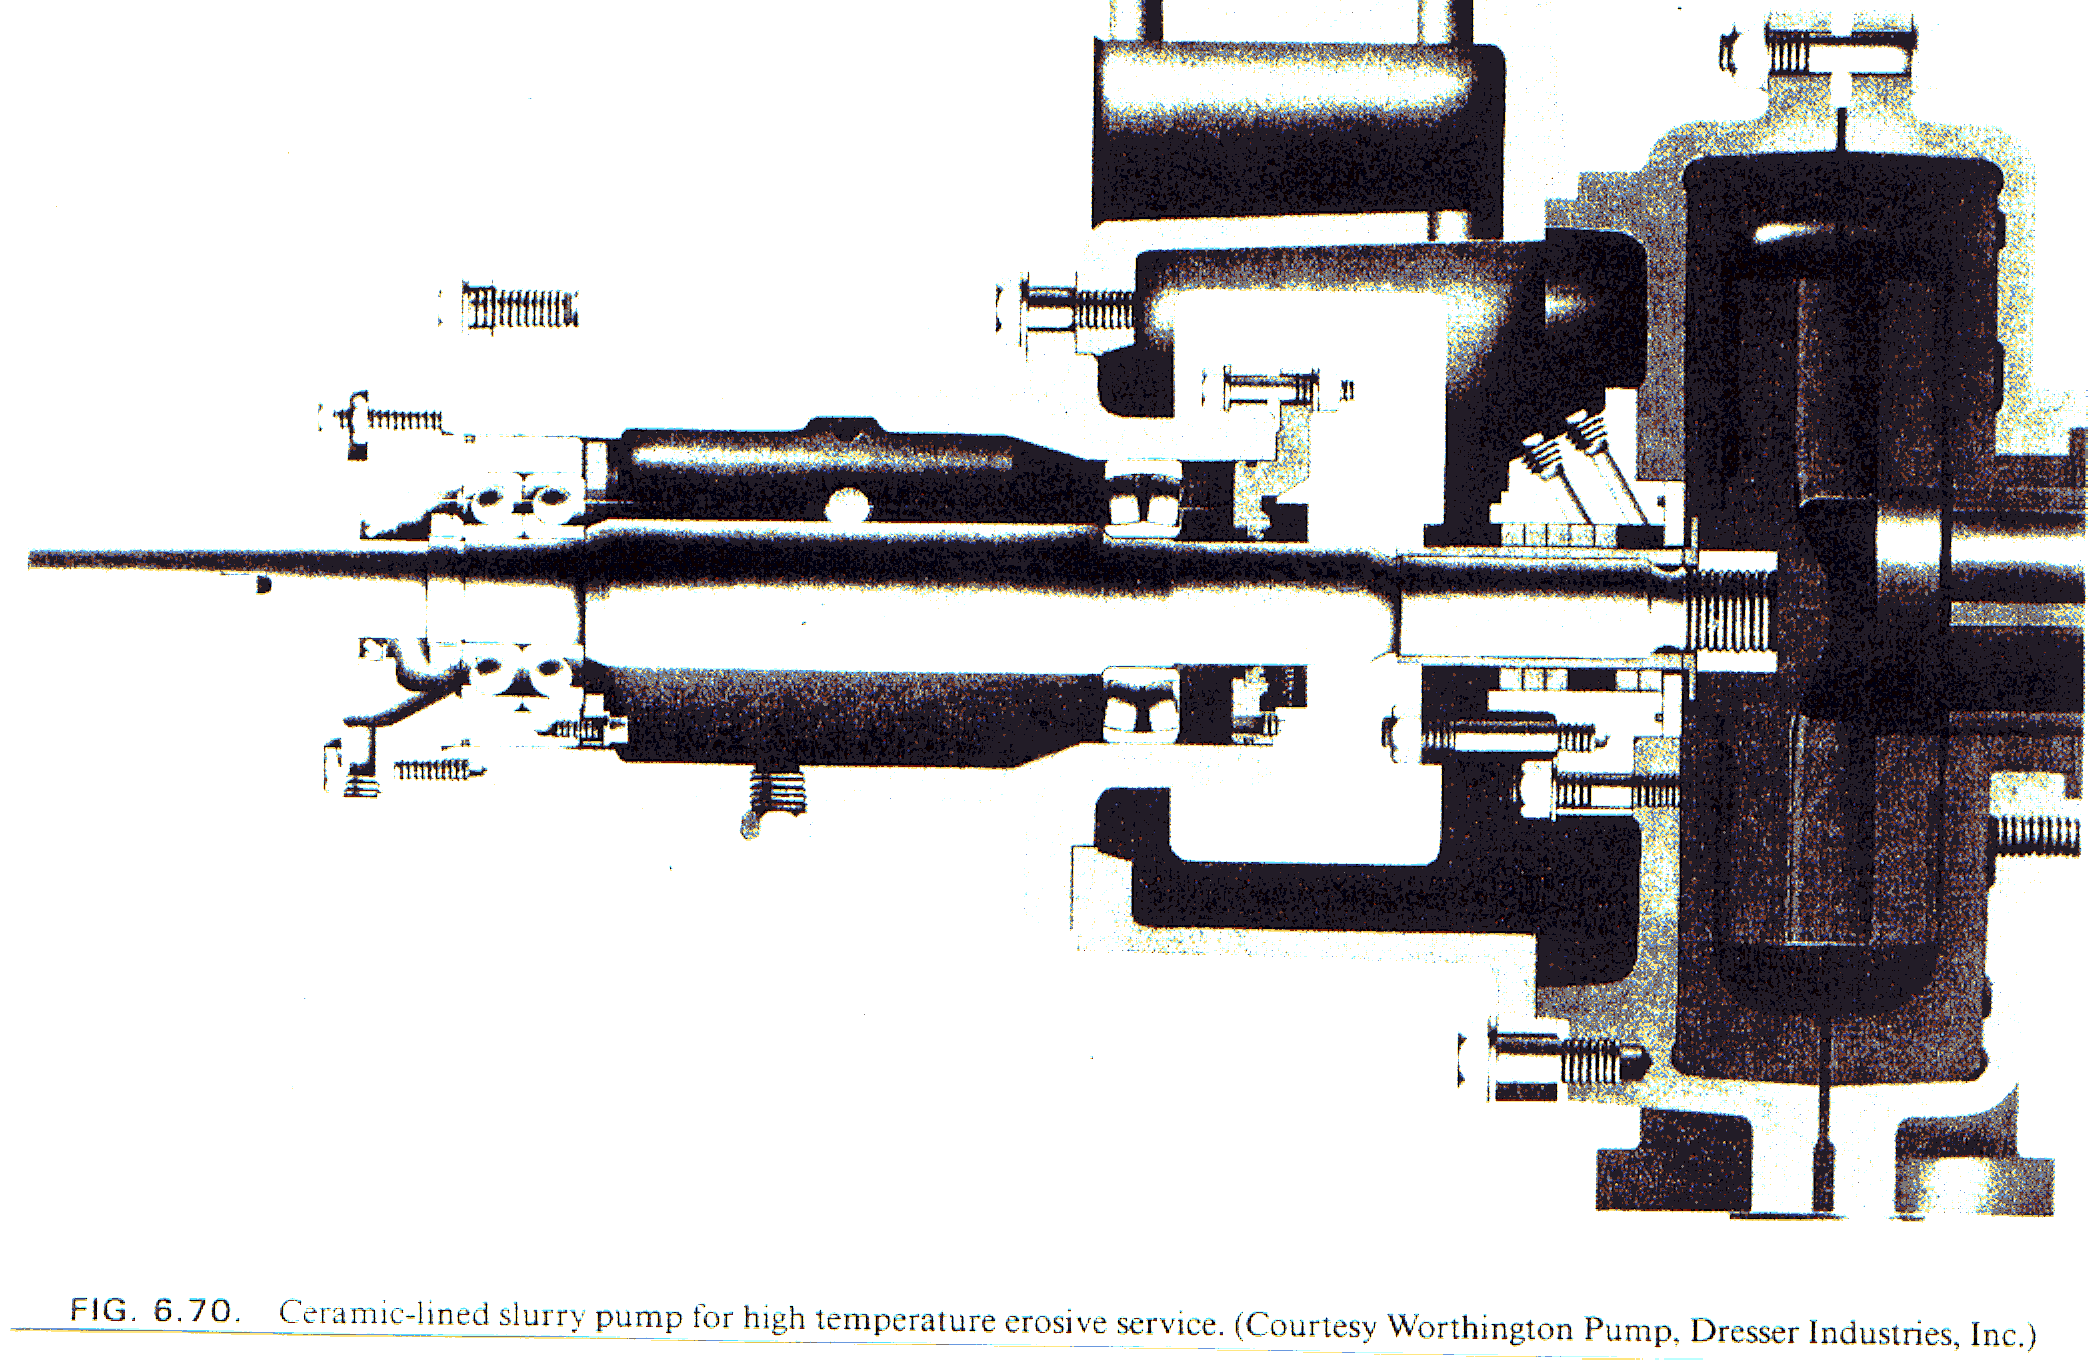
Chrome-lined slurry pump for high-temperature erosion service
General material-duty screening matrix
This historical matrix groups several different grades and media. Its symbols reproduce the training source: × acceptable, ? borderline, * not acceptable. They are teaching categories, not approval for an actual chemical duty; concentration, temperature, impurities, grade, exposure and stress can change the result. In particular, the original row places alcohol with hydrocarbon examples, although alcohol is chemically a different class.
| Duty | Steel / ductile iron | 316 / special alloys | Plastic | Common rubbers | Glass / ceramic | PTFE / graphite / Viton |
|---|---|---|---|---|---|---|
| Mildly corrosive liquids | × | × | × | × | × | × |
| Hydrocarbons (source examples: benzene and alcohol) | × | × | ? | ? | × | × |
| Chlorinated hydrocarbons with trace HCl | × | × | * | * | × | × |
| Alkali (e.g. NaOH) | × | × | × | ? | * | × |
| Acids (e.g. HCl) | * | ? | × | ? | × | × |
| Physical stress: thermal shock / piping loads | × | × | * | × | * | ? |
The grouped “316 / special alloys” column must not be read as a single alloy recommendation. View original matrix and symbols.
Include non-metallic wetted parts
Non-metallic pump components may include elastomers, plastics, ceramics, graphite and glass. Check seals, liners and other wetted nonmetals against the actual liquid, concentration, temperature, pressure and exposure duration. Possible outcomes include swelling or softening of an incompatible elastomer and environmental stress cracking of a susceptible polymer. Oxygen and ozone exposure can age rubber outside the wetted zone; this is a different exposure from attack by the pumped liquid. Inspect the actual component and confirm its compound or polymer grade before choosing a replacement.
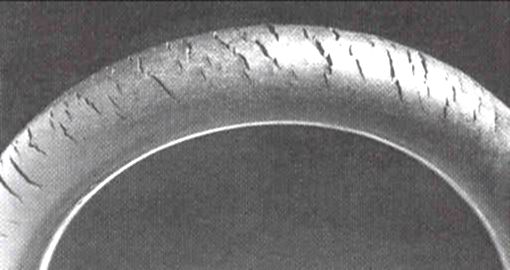
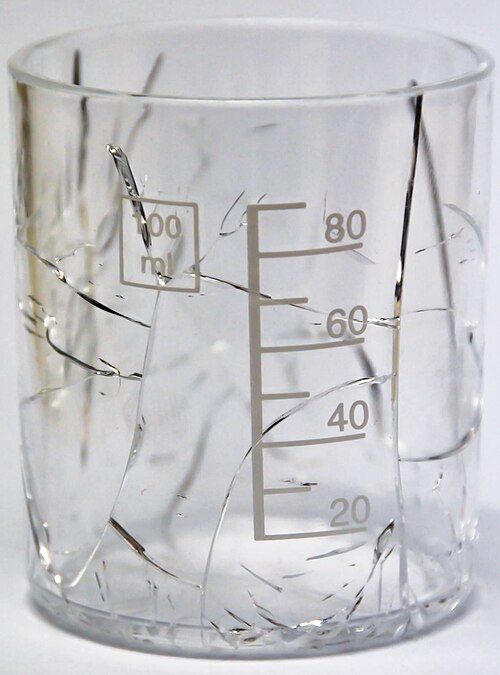
The two photographs are independently documented examples of different nonmetallic damage mechanisms. Neither photograph shows a Petropedam product or establishes compatibility of a specific pump seal or liner.
Sealing-material selection references: Parker O-Ring Handbook · medium, temperature and swelling · Trelleborg · chemical compatibility. The cited photographs illustrate visible damage; they do not determine an allowable fluid or temperature for a Petropedam seal.
Selection handoff: the corrosion dossier
Liquid
Identity, concentration range, pH, temperature, chlorides/oxidants/sulfides, dissolved oxygen, solids and entrained gas.
Operating conditions
Normal/upset cases, stagnation, cleaning, flow velocity, pressure, cavitation risk, vibration and duty duration.
Construction
All wetted alloys and coatings, weld/heat-treatment records, metal couples, gaps, seal faces, elastomers and liner.
Evidence
Service-specific compatibility and corrosion/erosion data, material specifications, vendor experience and an engineer's review. Only then finalize pump type and hydraulic duty.
Source: Petropedam engineering training material. Cross-checks: AMPP · Forms of Corrosion · AMPP · Galvanic Corrosion · AMPP · Graphitic Corrosion Terminology · AMPP · Brass Dezincification · AMPP · Stress Effects · BSSA · Intergranular Corrosion. Engineering teaching material; no quantitative material grade or guaranteed service life is asserted.
What a pump does before we read its curves
The corrosion lesson identified which liquid and wetted materials need attention. Now follow that liquid through the pump and the whole installation. This is the transition made on the Petropedam training material.
A pump transfers mechanical energy from a driver to a liquid. In a centrifugal pump, liquid enters at the suction, passes through the impeller, and leaves the casing through the discharge. The added energy supports flow against differences in vessel pressure and elevation as well as losses in the pipework.
Twelve terms in the original pumping overview
the original teaching figure lists the vocabulary used in the next chapters. The short explanations below let a first-time reader follow the system diagram; the later sections develop the equations and checks.
Energy and flow
1. Pump energy / head: energy added per unit weight of liquid, often expressed in metres. 2. Flow, Q: liquid volume per time. 3. Energy added: what the driver and pump deliver to overcome the system requirement.
System and suction
4. System characteristic: head required at each flow by the installation. 5. Hydraulic power: ρgQH delivered to the liquid (with Q in m³/s). 6. NPSHA: system-supplied absolute suction head above the liquid's vapor-pressure head.
Liquid and geometry
7. Dissolved gases: may come out of solution as pressure falls and affect suction behavior. 8. Specific speed: a unit-dependent index relating speed, flow and head to hydraulic type. 9. Suction specific speed: a separate suction-related index; record the unit convention before comparing values.
Operating behavior
10. Number of stages: impellers in series inside one pump. 11. Operating capacity: actual flow at the installed operating point, which may differ from normal or rated flow. 12. Stability: whether the pump and system can maintain a suitable operating state as conditions change.
System Characteristics & Operating Point
The pump does not choose the flow independently. The operating flow occurs where the pump curve intersects the system curve for the active piping, vessel pressures and control configuration.
The vessels and piping largely define the steady system requirement independently of the selected pump. For reciprocating or some rotary pumps, pulsation and acceleration can also change the instantaneous suction condition; evaluate inlet adequacy with the actual pump and duty.
Trace the liquid from vessel 1 to vessel 2
The source vessel sets pressure P1 and liquid level z1. The pump draws liquid through the suction pipe (point 2), adds head between its suction and discharge connections (points 2 and 3), and sends the flow through discharge piping to the receiving vessel at P2 and z2 (point 4). Pipe and equipment losses increase with flow; the energy balance therefore changes as Q changes.
Read the source sketch's hydraulic gradient: energy falls along the suction and discharge pipework because of losses and rises across the pump by the head it adds. The suction pressure must also remain sufficiently above the liquid's vapor pressure; NPSHA is checked separately from the plotted total system head.
From the physical route to the operating point
For this illustrative turbulent-flow case, required head is approximately Hsystem(Q) = Hstatic+pressure + hloss(Q), with hloss often approximated as KQ² over a limited operating range. The intersection with the vendor's pump H–Q curve gives the installed operating point; changing vessel levels, pressures or a valve changes the system curve.
Source: Petropedam engineering training material; Hydraulic Institute: pump/system operating point and NPSHA terminology.
Static / pressure component
Elevation difference and vessel-pressure difference can create a head requirement that is largely independent of flow.
Friction / equipment component
Piping, fittings, valves, filters and exchangers create flow-dependent losses. For turbulent piping, the friction component often varies approximately with Q² over a limited range.
Normal, rated, minimum and maximum are different concepts. Rated flow is the specified design point. It should not automatically be treated as the maximum flow or as “normal + 5%.” Define every required operating case explicitly.
Reference Datums & Pressure Basis
- Use a consistent elevation datum for static head calculations.
- Pressure differences used for TDH may be based on gauge or absolute pressure provided both are consistent; NPSH calculations require absolute pressure.
- For vertical pumps, define the applicable first-stage impeller datum for NPSH.
- Calculate the system curve for each meaningful valve/equipment configuration, not only one “normal” condition.
From pump energy to suction conditions
With the two vessels and their connecting pipework in view, follow the original lecture sequence: pump energy, flow definitions, system head, changing system conditions, NPSHA, cavitation, gas and the transition to pump classification.
Pump energy and energy at suction
The pump adds energy to move liquid from suction to discharge. That energy must overcome the difference in boundary pressure and elevation plus losses in suction piping, discharge piping, valves and equipment. At a steady operating point the pump's developed head equals the system's required head at the same flow; this is why discharge pressure alone does not state the complete pump head.
The original figure's “net energy at suction” leads into NPSHA: compare absolute total suction head with the pumped liquid's vapor-pressure head at its actual temperature, using the specified pump datum. This is a suction condition to check separately from total system head.
Rated, normal and minimum flow
Rated flow
The flow specified as the rated design duty for the selected pump. It is a contractual/design point, not automatically the highest flow the system will see.
Normal flow
The flow expected for most operating time. State whether the process has more than one normal case.
Minimum flow
The lowest required operating flow; it must be checked against the pump's allowable and continuous minimum-flow limits.
What the original figure says: it treats rated flow as generally the maximum and proposes a 5% margin over normal flow to avoid oversizing. Project check: neither assumption is universal. Define the normal, rated, minimum and maximum cases from the process specification, then check the manufacturer's operating limits. A 5% design margin can be considered only where justified for that service.
What makes up system head?
The original figure breaks the system requirement into pressure difference, liquid-level/elevation difference and friction losses. At equal boundary velocities: Hsystem(Q) ≈ ΔP/(ρg) + Δz + hfriction and equipment(Q). Include a velocity-head difference if the chosen boundaries require it. Use one elevation datum and the same pressure basis at both ends.
The training material sketches hf proportional to Q for laminar flow and hf approximately proportional to Q² for turbulent flow. These are teaching approximations under specified pipe and fluid conditions; calculate friction with the actual Reynolds number, roughness, fittings and equipment. Its reference-datum examples are the horizontal shaft centerline, a vertical pump's first-stage impeller, and a can pump's suction-nozzle centerline. For procurement, use the datum required by the applicable standard and the manufacturer's drawing; do not substitute a generic datum for NPSH.
The system curve can move
the original teaching figure shows a family of system curves rather than a single fixed line. As source or destination levels change, a pressurized receiving vessel fills and its gas pressure varies, or valve resistance changes, the required head changes. Draw credible minimum and maximum cases. Their intersections with the same pump curve define a range of possible operating flows.
Build NPSHA from the suction system
The figure's five terms can be written for a source vessel with gauge pressure Ps1,g as: NPSHA = (Ps1,g + Patm − Pv)/(ρg) + (z1 − zdatum) − hf,1→2 − ha. Here Pv is absolute vapor pressure at pumping temperature, hf,1→2 is suction-line loss, and ha is an acceleration-head allowance only where pulsating or transient suction flow requires it. If source pressure is already absolute, do not add atmospheric pressure again.
The figure notes that two pressure terms cancel when a source liquid is at saturation: specifically, source-surface absolute pressure equals liquid vapor pressure if the source is in equilibrium. That cancellation does not make the remaining suction-loss or elevation terms disappear. Check the worst credible combination of source level/pressure, temperature, flow and transients. The original figure instructs calculating suction friction at the maximum flow rather than normal flow; this is an important high-flow check, but another combination may produce the lowest NPSHA.
NPSHA, NPSHR and cavitation
As suction pressure falls, a liquid can form vapor cavities; when those cavities move into higher pressure, collapse may cause noise, vibration, loss of head and eventual impeller or casing damage. NPSHA belongs to the system. NPSHR is a manufacturer-supplied pump characteristic for specified flow, speed and liquid. NPSH3 identifies the tested 3% head-drop criterion; equality with it does not mean cavitation-free service. Apply an appropriate project-specific margin and assess the full operating range.
The figure describes NPSHR for a centrifugal pump as a head and discusses NPIP for reciprocating and some rotary pumps. Use the governing pump standard and vendor terminology for each technology. Its shorthand that NPSHR is independent of specific gravity does not establish universal independence from liquid properties or service; confirm the vendor basis and any required corrections.
Dissolved gas and free gas
The figure raises three effects: gas can lower pump performance; gas bubbles are distinct from vapor cavities that collapse; and a gas phase can sometimes cushion a pressure pulse, as the figure suggests may reduce damage. This possible cushioning is not a design method or cavitation safeguard. The distinction is useful, but the figure calls gas “incompressible,” which is incorrect. Gas is compressible. Gas dissolved at high pressure can come out of solution when suction pressure drops, creating a free-gas fraction. Free gas can reduce centrifugal-pump head, disrupt priming or cause gas binding. It should never be treated as a reliable way to prevent cavitation or erosion.
Next chapter: pump classification
The next section introduces the classification of rotodynamic and positive-displacement pumps. Continue with the pump-classification chapter after the hydraulic and suction checks below.
Source: Petropedam engineering training material. Technical cross-checks: Hydraulic Institute system curves, HI definitions and NPSHA, and HI NPSH margin guidance. Statements from the original lecture that would mislead when applied universally are retained and qualified alongside the corrected engineering explanation.
Pump Classification — Choose the Technology from the Service
The original presentation separates kinetic/rotodynamic and displacement pumps. That framework remains useful, but no single variable such as pressure or viscosity should decide the technology by itself.
🔵 Rotodynamic Pumps
Continuous energy transfer to the liquid
Cover a very broad range of flows and heads. Particularly attractive for continuous transfer where a smooth flow and efficient hydraulic match can be achieved.
🟠 Positive-Displacement Pumps
Displace a defined volume per cycle/revolution
Strong candidates for viscous fluids, high differential pressure, controlled-volume or metering-like duties and services where a PD characteristic is advantageous.
Technology Screening Matrix
| Service factor | Rotodynamic tendency | Positive-displacement tendency |
|---|---|---|
| High flow / moderate head | Often strong | Technology-specific |
| Very high differential pressure at modest flow | May require multistage | Often strong |
| High viscosity | Requires viscous correction | Often advantageous |
| Precise flow regulation / metering | Needs control system | Often advantageous |
| Abrasive solids | Slurry-specific hydraulics/materials | Depends strongly on PD type |
| Shear-sensitive liquid | Evaluate speed/impeller | Evaluate PD technology |
Calculating Total Dynamic Head (TDH)
TDH is the specific mechanical energy that the pump must add to the liquid, expressed as head of the pumped liquid.
General form: Hpump = (P2 − P1)/(ρg) + (z2 − z1) + (V2² − V1²)/(2g) + hL
For pressures in bar and specific gravity SG, a convenient approximation for pressure-head difference is:
Static / Elevation Head
Difference between the selected suction and discharge reference elevations.
Pressure Head
Difference in source/destination pressure converted to head of the pumped liquid.
Friction & Equipment Losses
Pipe, fittings, control valves, filters, exchangers and other equipment at the specified flow.
Velocity Head
Include when suction and discharge reference velocities differ materially.
Understanding Centrifugal Pump Performance Curves
A complete selection reviews head, efficiency, NPSHR and absorbed power together. The diagrams below use the same illustrative SOH2 80-50-250 dataset so the relationships are easy to compare; final engineering must use the certified performance curve for the selected pump.
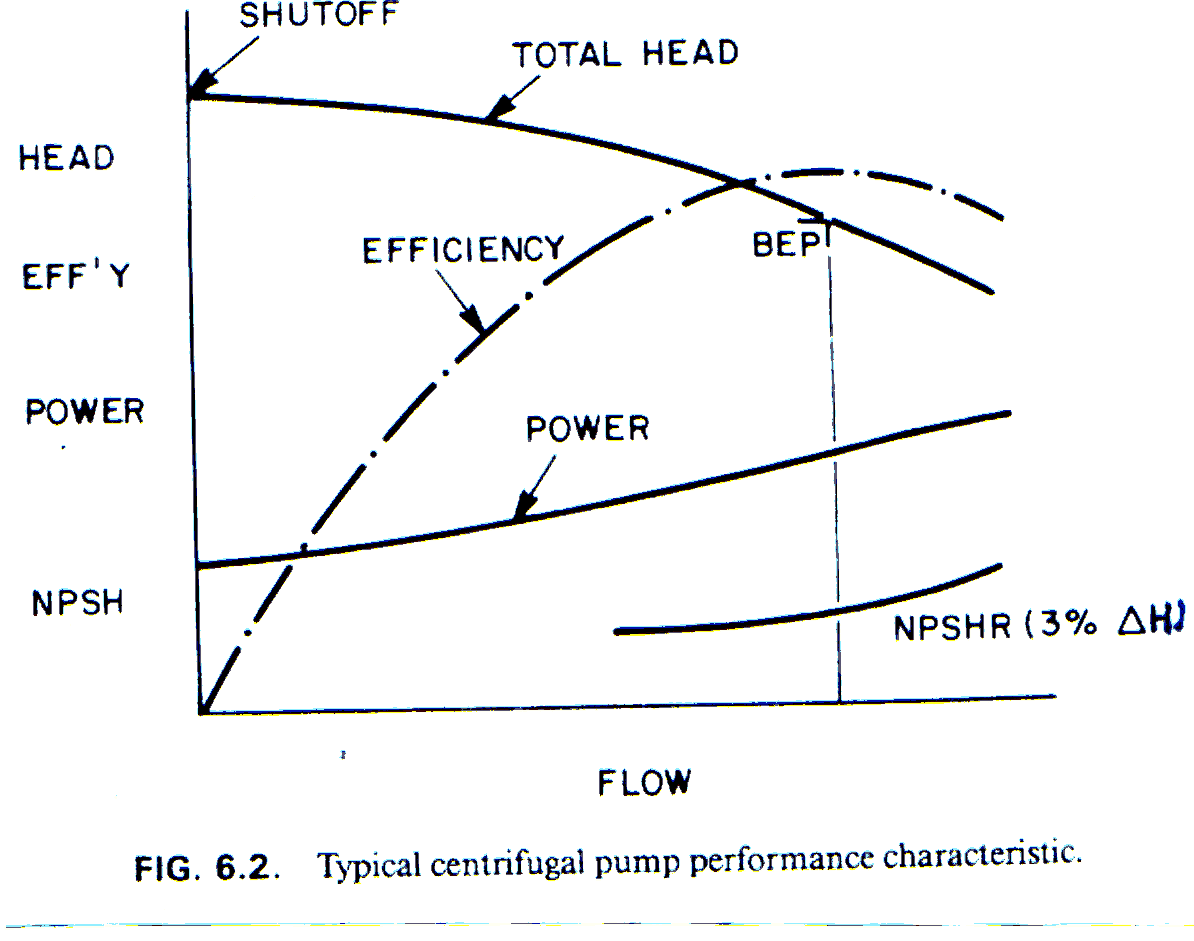
Read four performance curves at the same flow
Before comparing different specific speeds, examine a typical pump characteristic with head, shaft input power, efficiency and NPSHR (NPSH3) against flow. Shutoff is at zero flow. BEP is the maximum of the efficiency curve. Head typically falls across the illustrated range, shaft power rises in this example, and the NPSHR curve rises on its measured portion. The y scales for the four quantities are independent; use the separate charts below for actual numerical comparisons.
| Flow (m³/h) | Head (m) | Efficiency (%) | Power (kW) | NPSHR (m) | Interpretation |
|---|---|---|---|---|---|
| 0 | 78 | — | — | 1.2 | Shutoff reference |
| 30 | 70 | 70 | 8.2 | 2.2 | Low-flow point |
| 60 | 65 | 79 | 13.5 | 3.2 | Example rated point |
| 70 | 63 | 82 | 14.7 | 3.8 | BEP in example |
| 85 | 58 | 78 | 17.4 | 4.8 | High-flow point |
| 100 | 50 | 72 | 18.9 | 6.2 | Runout-side example |
Best Efficiency Point (BEP)
BEP is the flow at which efficiency is maximum for a specified speed and impeller geometry. It is a useful hydraulic reference, not a universal acceptance band by itself.
Petropedam ranks selections by proximity to BEP together with POR/AOR, NPSH margin, power, impeller trim, materials and mechanical suitability. A pump is not accepted only because its duty point is “near BEP.”
Low-flow side of BEP
Potential concerns include suction/discharge recirculation, radial thrust, internal heating, vibration, seal/bearing loading and unstable operation.
High-flow side of BEP
Potential concerns include rising NPSHR, higher velocity, erosion, driver overload, runout and inlet choking depending on pump design.
Engineering rule: use the manufacturer- or standard-defined operating region for the actual pump. Fixed percentages such as 70–120% or 80–110% of BEP may be useful as rough screening examples in some contexts, but they are not universal POR limits.
Specific Speed & Suction Specific Speed
Similarity parameters explain hydraulic geometry and suction behavior, but their numerical values depend on the definition and unit system. Never compare values from different conventions without conversion.
Specific Speed, Ns
Evaluated at a defined reference point, specific speed helps relate radial-, mixed- and axial-flow geometry, curve shape and practical stage selection.
Suction Specific Speed, Nss / S
Used as an indicator of suction geometry and inlet-recirculation sensitivity. It is not a stand-alone pass/fail criterion.
Radial-flow tendency
Generally associated with higher head per unit flow and lower specific speed.
Mixed-flow tendency
Intermediate hydraulic geometry; often selected where both head and flow are significant.
Axial-flow tendency
Generally associated with high flow, low head per stage and higher specific speed.
Historical Nss limits in the original presentation
The original training material discusses historical suction-specific-speed screening values of 11,000–12,000 (US convention), and 15,000–17,000 for particular designs and operating ranges. Preserve these values only as historical screening guidance. Current selection should evaluate the actual NPSH margin, inlet geometry, recirculation behavior, service severity and manufacturer experience rather than impose one universal Nss cutoff.
How specific speed changes impeller geometry and pump curves
The original profile figure shows six sectional impeller silhouettes across eight labeled Ns values. The next figure compares three characteristic curve groups, followed by a chart of BEP efficiency across pump sizes.
Define the number and follow the impeller profiles
US customary specific speed: Ns = n × √Q(BEP) / [H(BEP,stage)]0.75. Here n is rpm, Q is total pump flow at BEP in US gpm, and H is head per stage at BEP in ft. The original figure uses the maximum-diameter impeller. The 500–15,000 values below are specific speed Ns, not suction-specific speed Nss; they are indexed figures, not measured duties, efficiencies or limits for a product.
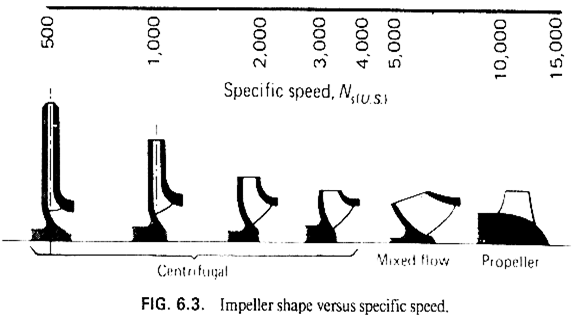
| Ns (US) | Illustrative impeller tendency | What to expect from the geometry |
|---|---|---|
| 500 · 1,000 | Narrow radial passages | Relatively high head per stage and lower flow. |
| 2,000 · 3,000 · 4,000 | Radial geometry opening toward mixed flow | Increasing flow in relation to head; do not infer an efficiency percentage. |
| 5,000 | Transition toward mixed flow in the source illustration | A broader exit passage than the low-Ns sketches. |
| 10,000 · 15,000 | Mixed-to-axial and propeller forms | Relatively high flow and lower head per stage. |
The profiles and groupings are qualitative; these eight values are points on a continuous index, not universal boundaries. To convert the same definition to the Hydraulic Institute's metric convention (rpm, m³/s, m head per stage), divide the US value by approximately 51.6. Check whether another source uses total flow or flow per impeller eye before comparing double-suction designs.
Worked example · calculate all eight Ns cases
To calculate a duty point consistent with each specific speed, fix speed and head per stage and solve the defining equation for flow: QBEP = [Ns × HBEP,stage0.75 / n]². For this arithmetic illustration alone, let n = 1,800 rpm and HBEP,stage = 100 ft. The same head and speed are hypothetical and are not taken from a Petropedam test.
| Ns (US) | 500 | 1,000 | 2,000 | 3,000 | 4,000 | 5,000 | 10,000 | 15,000 |
|---|---|---|---|---|---|---|---|---|
| QBEP (US gpm) | 77 | 309 | 1,235 | 2,778 | 4,938 | 7,716 | 30,864 | 69,444 |
Important: Ns plus this chosen speed and BEP head determines one calculated BEP flow. It cannot determine the whole head–flow, power or efficiency curves. The three drawings below reproduce the qualitative trends in the lecture; project curves require a manufacturer curve or test.
Head, shaft power and efficiency change with Ns
The source diagrams plot three different quantities against flow for low, intermediate and high Ns. Head starts at shutoff (zero flow), efficiency rises to a maximum at BEP and falls away, and shaft input power changes differently for each hydraulic design. The three lines are separately scaled teaching curves; their crossings have no numeric meaning.
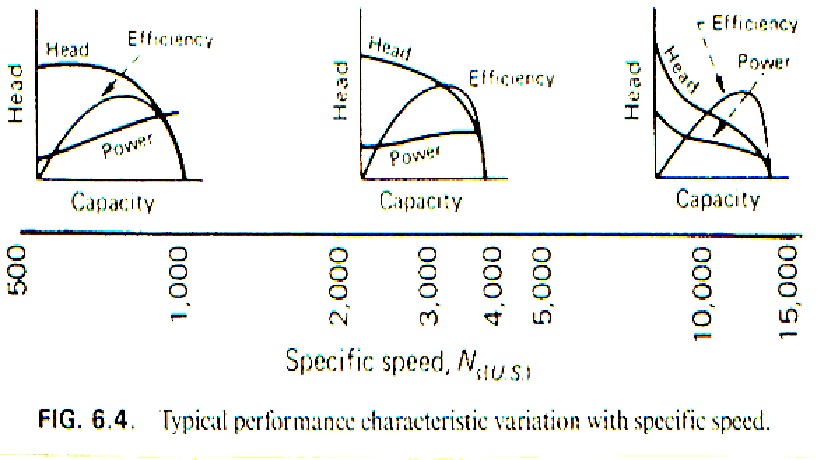
| Ns band in lecture | Head–flow curve | Shaft-power trend | Efficiency |
|---|---|---|---|
| 500–1,000 | Often flatter near low flow. | Generally rises toward higher flow in the sketch. | Peaks at BEP for the particular design. |
| 2,000–5,000 | Typically more drooping as Ns rises. | May level toward high flow; verify any peak. | Peak and usable region depend on actual hydraulics. |
| 10,000–15,000 | Steeper decline with flow in the sketch; greater shutoff-to-BEP head ratio is possible. | Can decline as flow increases; maximum load may occur at low flow. | Efficiency still has its own BEP. |
What the comparison changes in selection
The original says that shutoff head at higher Ns may reach about 2–3 times the BEP head. Treat this as a possibility shown in the teaching material, not a guaranteed ratio. Check the selected pump's certified Q–H curve and the system's shutoff pressure rating. Low-Ns sketches show a positive shaft-power slope; high-Ns sketches show a negative slope. A design can have maximum shaft power inside its operating range and be called non-overloading only when its full power curve and motor rating support that claim.
The lecture also warns that chasing a non-overloading power curve by selecting an oversized pump may reduce efficiency. Evaluate the actual BEP, the specified operating range, motor load and power peak before accepting a design. At the same Ns, different impeller geometry, trim, speed and liquid can yield different curves.
Attainable BEP efficiency depends on both size and Ns
The efficiency chart plots BEP efficiency (%) against Ns for separate curves labeled by BEP capacity (US gpm). This is a comparison between differently sized pumps at their own best-efficiency points. It is not an efficiency-versus-operating-flow curve for one selected pump. The historical source also distinguishes single/double suction pump efficiency (solid curves) from wet-pit bowl efficiency (dashed curves); the original chart below retains both sets of curves.
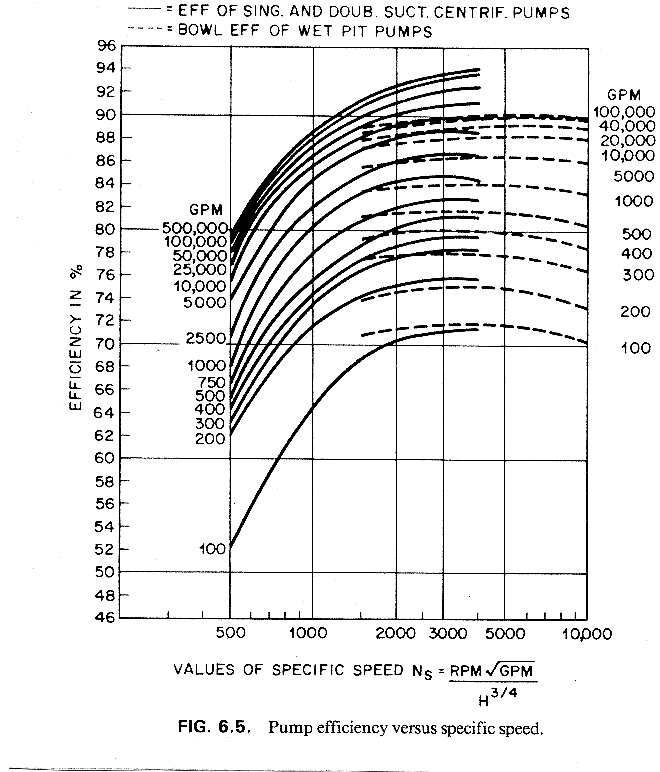
Read the figure qualitatively: larger BEP flow generally offers higher attainable efficiency, while specific speed has an optimum region for each configuration. The current Hydraulic Institute HI 20.3 uses pump type, BEP flow, specific speed, design features, roughness and internal clearances to estimate normally attainable BEP efficiency. This historical plot must not replace that procedure or a certified efficiency curve. For a small pump, a wet-pit bowl, a slurry pump or a double-suction API pump, use the appropriate type and flow convention.
Original source: Petropedam engineering training material. Cross-check: Hydraulic Institute, Pump Principles (specific speed convention, conversion and qualitative curve trends); Hydraulic Institute, Pump Curves (head, efficiency and shaft input power).
BEP, POR, AOR & Allowable Flow Range
The operating region is a reliability envelope. A pump can produce the requested head and still be an unacceptable selection if it operates outside its allowable region.
Current reference: ANSI/HI 9.6.3-2024 addresses operating regions for rotodynamic pumps. POR and AOR are not universal fixed percentages for every pump.
Minimum-flow constraints
Thermal rise, suction/discharge recirculation, radial/axial loads, vibration, seal/bearing limits, minimum stable flow and process requirements may govern.
Maximum-flow constraints
NPSH, power, runout, inlet choking, erosion/velocity, vibration and hydraulic stability may govern.
NPSH — Suction Performance & Cavitation Margin
NPSHA is a system characteristic. NPSHR is a manufacturer-supplied pump characteristic; NPSH3 is the tested NPSH associated with a 3% head drop under the applicable test definition.
Current guidance: ANSI/HI 9.6.1-2024 is the current Hydraulic Institute guideline for NPSH margin. Its 2024 update explicitly distinguishes NPSHA, NPSHR and NPSH3 and uses manufacturer-supplied NPSHR as the margin reference.
NPSHA — available
Calculate from absolute suction pressure/head, velocity and elevation terms minus vapor-pressure head and suction losses, using the correct datum and worst credible operating condition.
NPSHR — required
Use the manufacturer-supplied value for the selected pump, speed, impeller and operating point. Do not extrapolate casually across large changes in speed or geometry.
What Cavitation Means
Cavitation occurs when local pressure falls sufficiently for vapor cavities to form and then collapse as they move into higher-pressure regions. Effects can include noise, vibration, erosion, head loss and instability. Erosion or noise may begin before the conventional 3% head-drop point.
What Reduces NPSHA?
Higher temperature
Usually raises vapor pressure and therefore reduces available suction margin.
Higher suction loss
Long/small piping, fittings, strainers and high flow reduce suction pressure at the pump.
Lower source pressure/level
Vacuum, altitude or low vessel level can reduce NPSHA.
Transient effects
Acceleration head, pulsation, rapid valve changes and long lines can temporarily reduce suction pressure.
Reciprocating and rotary inlet terminology
Positive-displacement pump inlet systems are strongly affected by pulsation and acceleration. Depending on the applicable standard and pump technology, inlet adequacy may be expressed using NPSH- or pressure-based terminology such as NPIP. Always use the terminology and method required by the governing pump standard/vendor.
How the 3% head-drop test is performed
At a fixed flow and rotational speed, the test pump is operated at several progressively lower values of available suction head. The head initially remains almost constant, then decreases as cavitation affects the passages. The NPSHA at a 3% reduction in the reference head is reported as NPSH3; for a multistage pump, this criterion applies to the first-stage head. The original training material calls this value NPSHR. Here, NPSH3 identifies the test criterion explicitly, while NPSHR remains the manufacturer-specified requirement used for selection.
Insufficient suction head can cause both cavitation erosion and loss of performance. These consequences need separate assessment: preserving most of the measured head does not establish that the impeller is free of damaging cavitation.
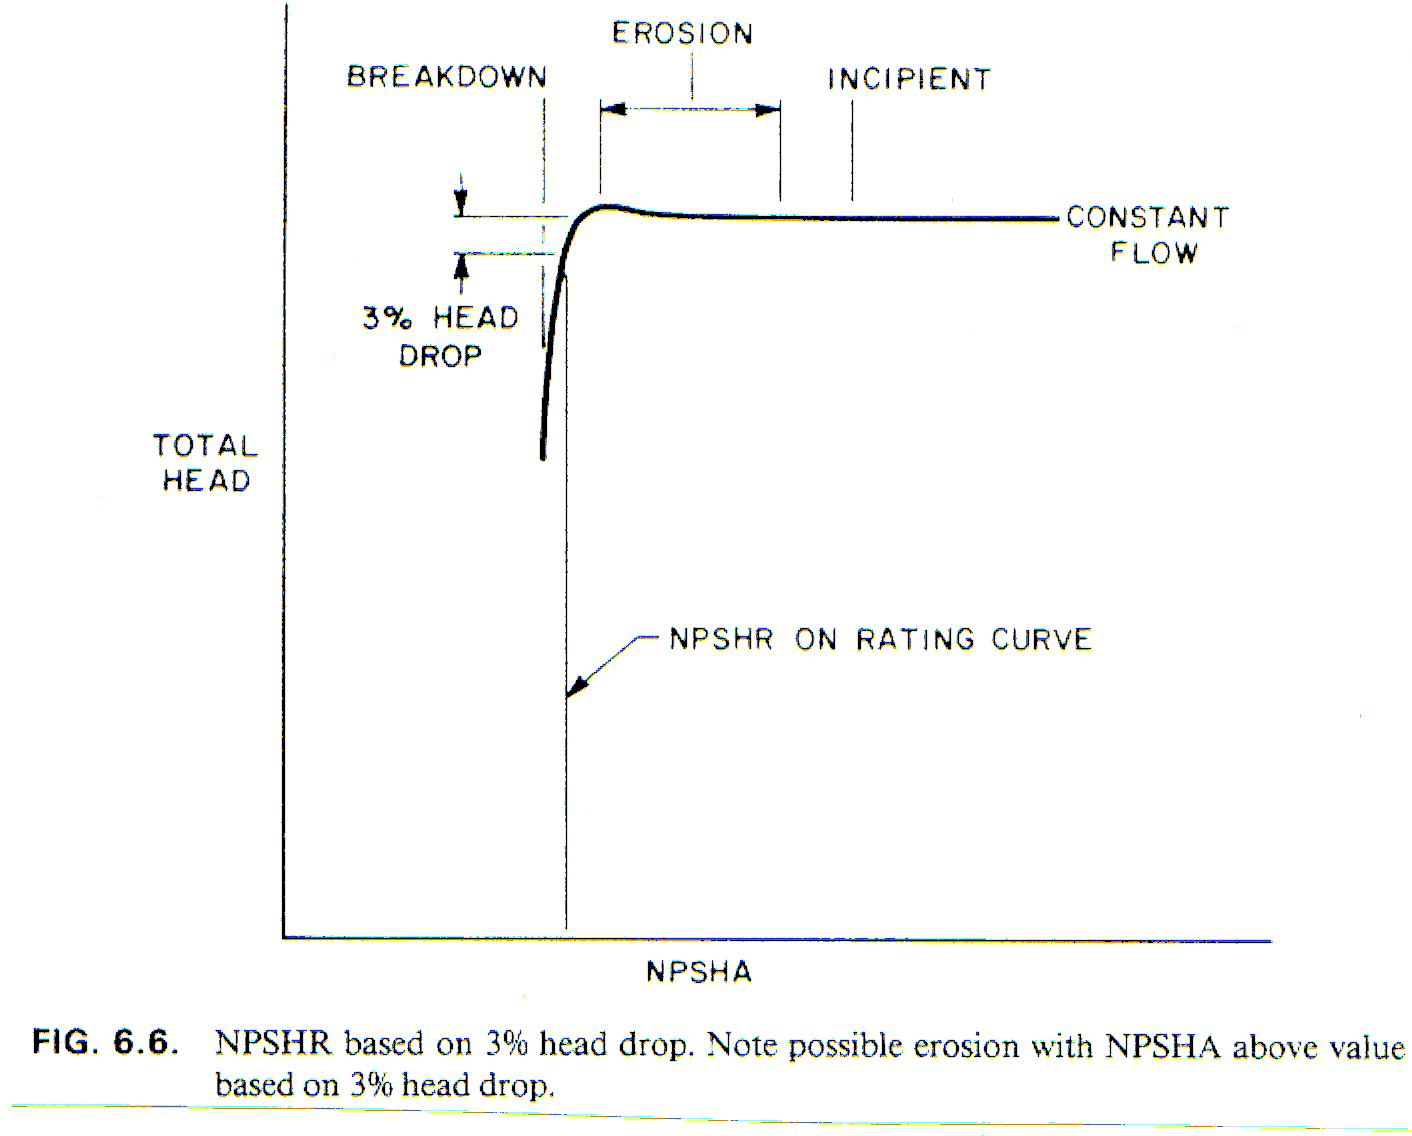
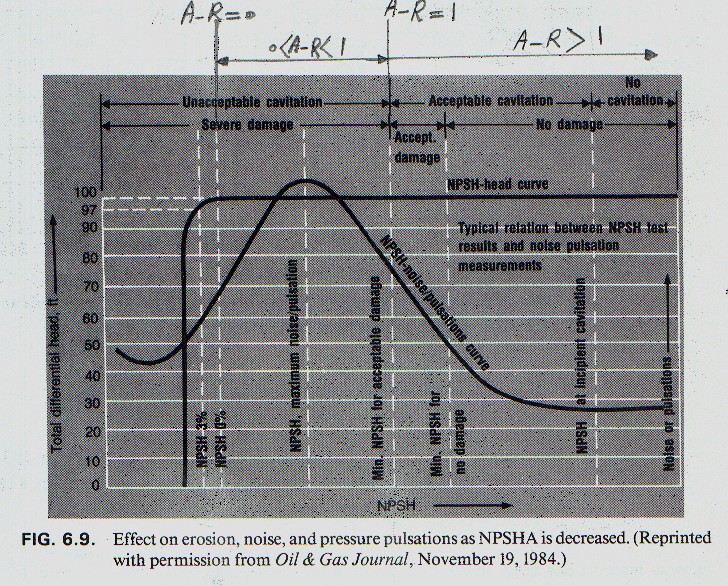
Cavitation effects do not all reach their limits at the same NPSH
The following original figure follows erosion, noise and pressure pulsations as NPSHA decreases. It shows why a single head-drop measurement cannot describe all cavitation effects. The severity may change non-monotonically; a quieter condition alone does not prove that erosion has disappeared.
Two limitations of interpreting the head-drop test
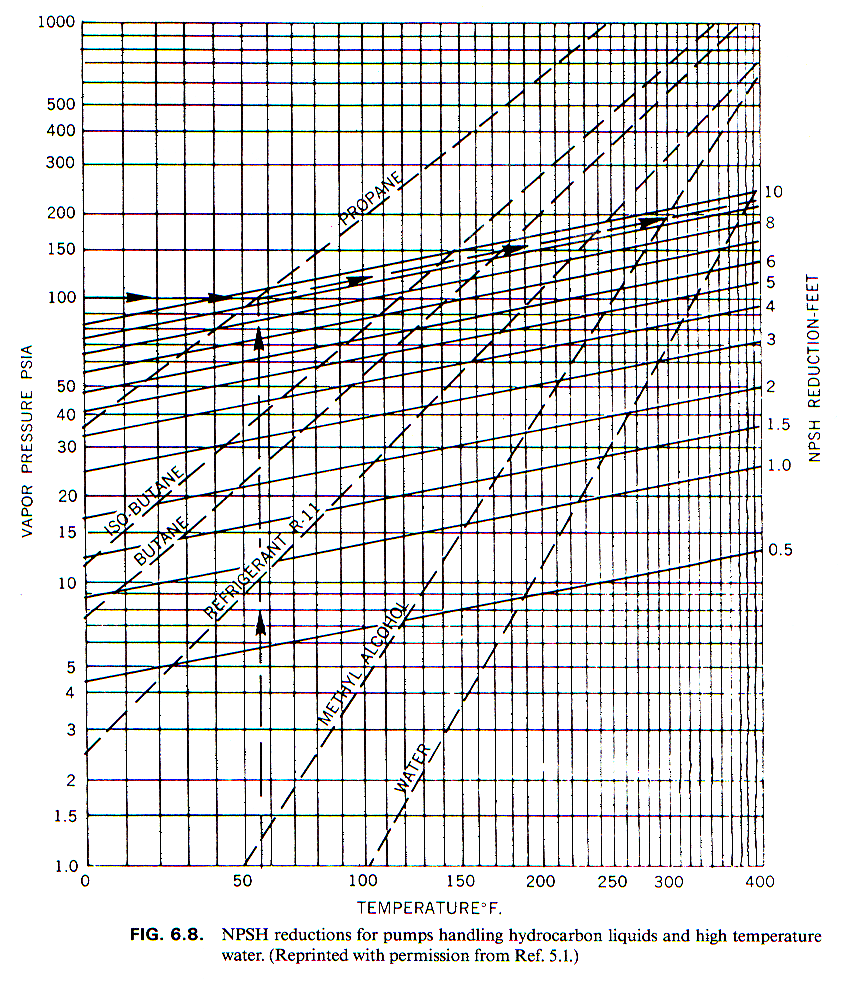
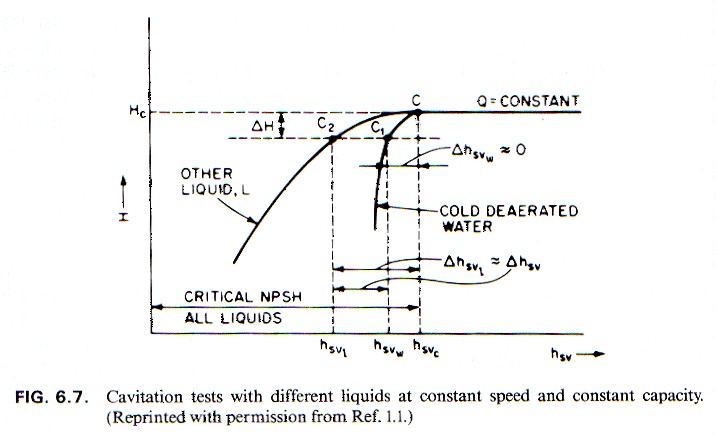
The presentation identifies two limitations: the dependence of head breakdown on the vapor-to-liquid specific-volume ratio, vg/vf, at the inlet, and the relationship between the measured head loss and cavitation severity. Liquid temperature and thermodynamic properties can therefore change how a water-test result relates to the actual service.
The original reduction chart compares hydrocarbon liquids and high-temperature water, with temperature in °F and head reduction per stage. The next figure compares cavitation tests in different liquids at constant speed and capacity. Together they illustrate a thermodynamic effect, rather than an instruction to subtract a generic correction from every published NPSH curve. Apply a liquid-specific correction only with the manufacturer's validated method and the applicable project requirements.
Why erosion can occur before a 3% head loss
The presentation describes research available in 1984–1986: depending on impeller material, hydraulic design and energy level, cavitation causing a 3% head loss—and even cavitation producing a smaller loss—could cause erosion. A smaller head-drop criterion was consequently proposed as an alternative definition of the required suction head.
Further observations showed that erosion could occur with available NPSH above the 3% head-drop value. Merely redefining the test around a smaller percentage did not establish an erosion-free condition. In the presentation's design discussion, suction specific speed brings related inlet-design characteristics into a common index. It supplements assessment of cavitation and recirculation; it cannot replace a service-specific NPSH margin.
Suction specific speed: definition, units and impeller-eye flow
Suction specific speed is a similarity index describing inlet hydraulic characteristics independently of physical pump size. The source uses the symbol S and bases its charts on the 3% head-drop criterion. To make the US unit convention explicit, the equation below uses Nss.
- n: rotational speed in rpm.
- Qeye,BEP: flow per impeller eye at BEP, in US gpm. Use total flow for single suction and half the total flow for double suction.
- NPSH3BEP: the defined 3% head-drop NPSH at BEP, in ft, for the maximum-diameter impeller.
These numerical indices depend on the unit convention; Nss is not a flow rate even though the source associates its values with US gpm. Specific speed Ns uses head per stage, while suction specific speed Nss uses NPSH3. Keep the two indices separate.
Higher suction specific speed and the operating range
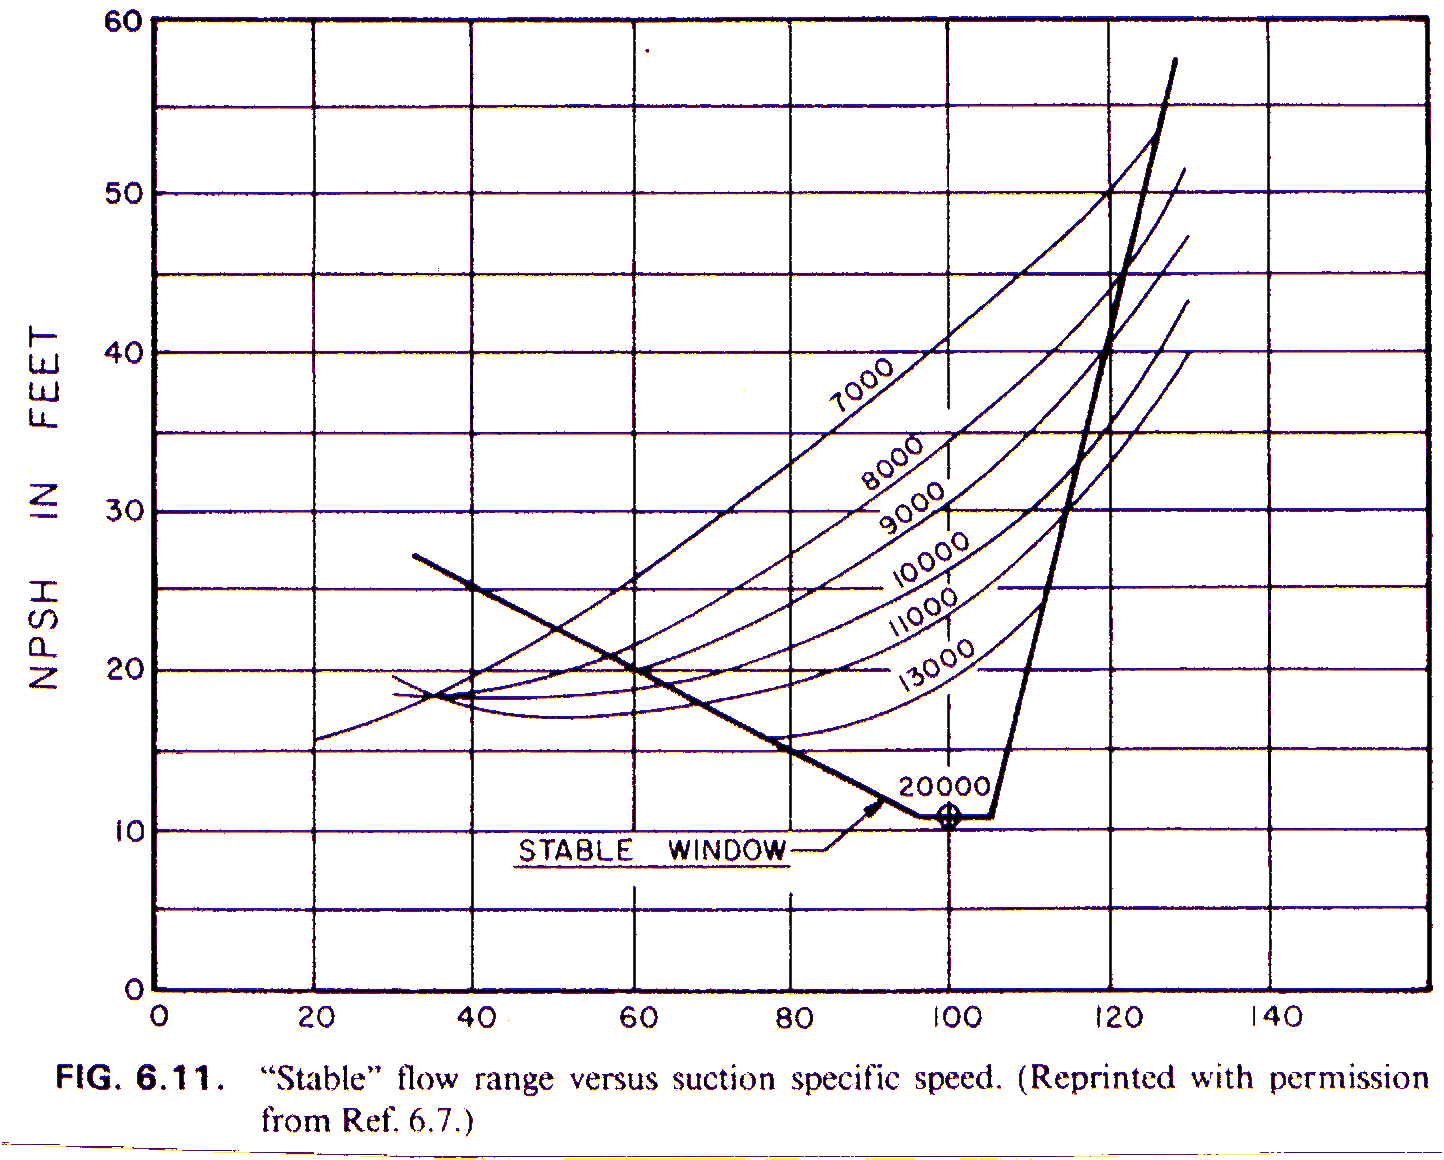
The source highlights two design tendencies as suction specific speed increases: a greater separation between incipient-cavitation NPSH and the 3% head-drop NPSH, and a greater tendency toward inlet recirculation. Noise, vibration and impeller erosion can become more significant, especially when the required flow range extends farther from the design condition. These tendencies must be checked against the actual inlet design and operating curves.
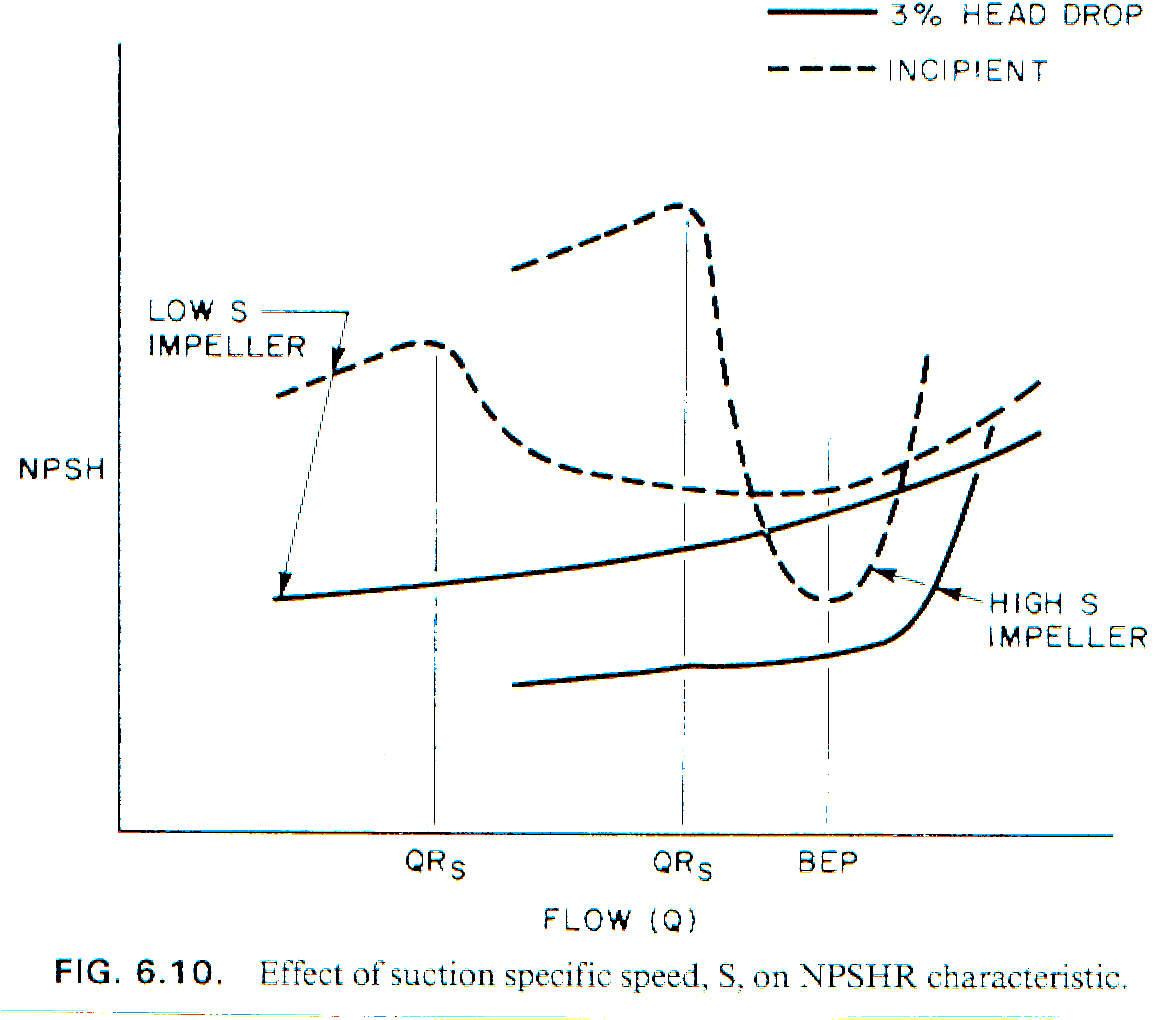
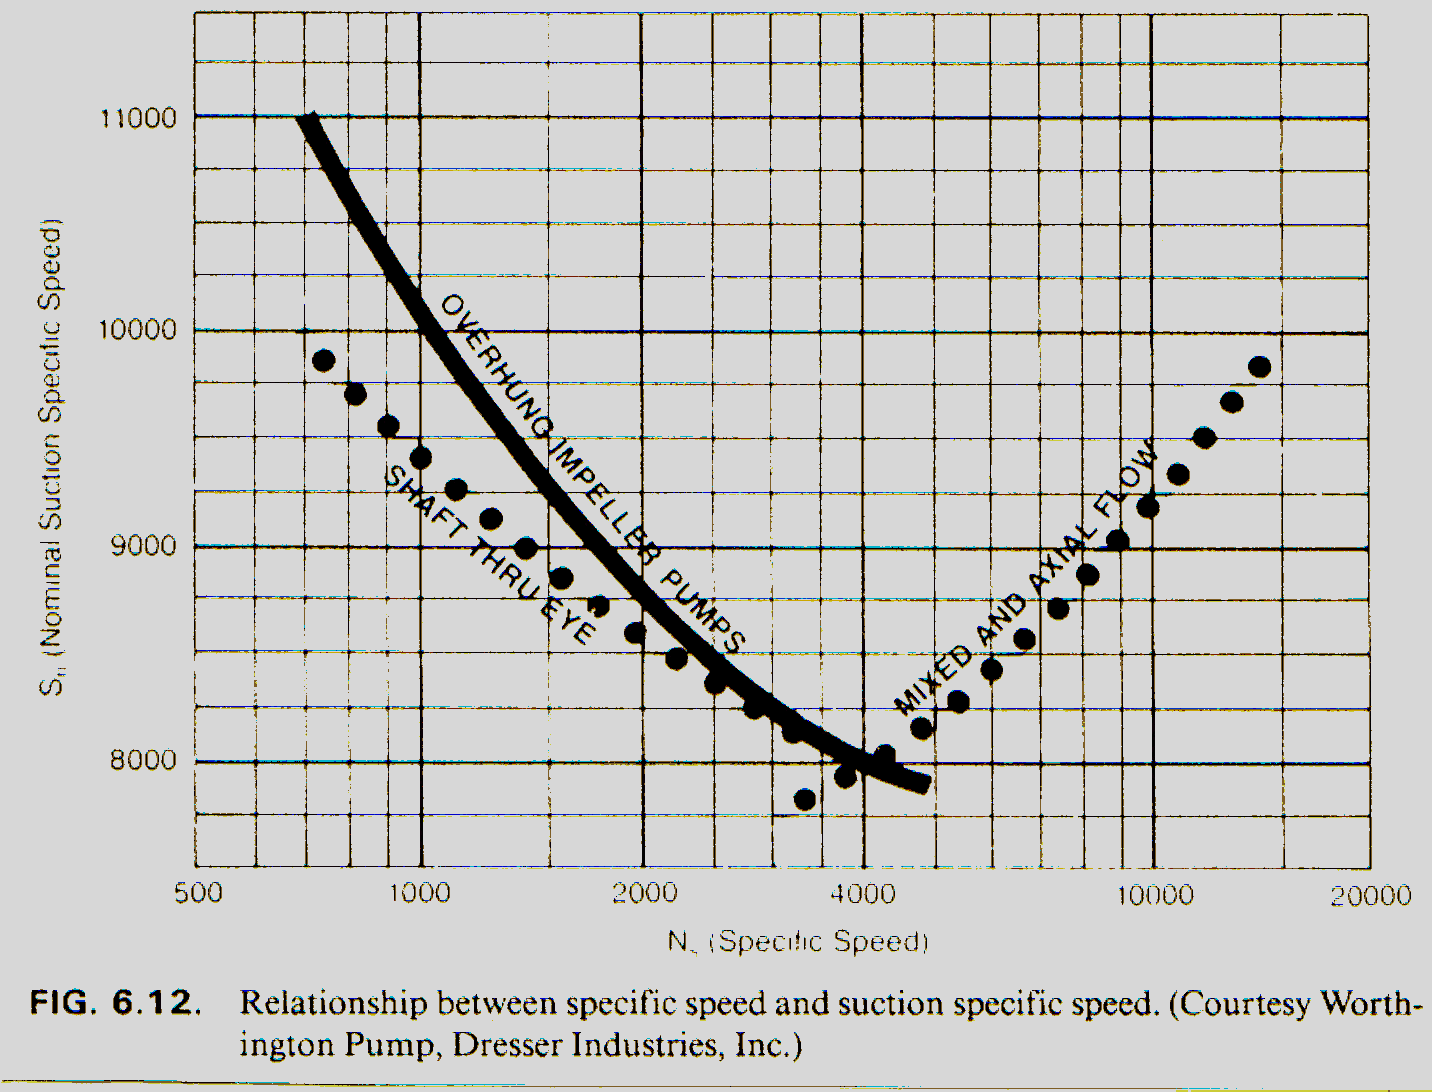
The presentation reports historical screening values of 11,000–12,000 in the US convention. It then discusses research indicating that 15,000–17,000 could be used for particular designs and operating ranges. Both ranges are retained here as part of the engineering lesson. They are neither universal current-standard limits nor blanket approval for a selected pump.
The next curve family shows how suction behavior changes across percent rated flow at different suction-specific-speed values. Review the full range rather than only the rated point. The following relationship chart compares specific speed and suction specific speed for different impeller forms; the plotted experience applies to its source population and should not be treated as a general acceptance boundary.
Definition cross-check: Hydraulic Institute — Pump Principles. Project selection also requires the applicable NPSH-margin guidance and the manufacturer's service-specific curves.
System corrections during starting and fast control changes
For normal steady centrifugal-pump flow, the presentation uses the actual operating flow for pipe-friction calculations rather than the pulsation peak-flow method associated with reciprocating pumps. Starting, stopping or rapidly changing flow still requires transient assessment.
Long suction piping and fast-acting control valves can make acceleration head important to instantaneous NPSHA. The source describes transient inlet disturbances, cavitation and pressure shock during starting. Shorter, appropriately designed suction piping and a controlled start or valve sequence may reduce these disturbances; use a pump-specific procedure rather than a universal valve instruction.
The presentation gives 1.5 ft (approximately 0.46 m, rounded to 0.5 m in the source) as an acceleration-head allowance for suction lines shorter than 70 pipe diameters, with further analysis for longer lines. Preserve these as historical preliminary assumptions. Actual acceleration head depends on flow acceleration, line geometry and controls, not length ratio alone.
Choosing the suction margin for the actual system
The source calls for worst-credible NPSHA, including liquid properties, gas, acceleration and system-induced transient reductions. Margin above the required value is intended to account for performance deterioration and cavitation erosion as well as transient conditions.
Its historical recommendations are approximately 15% of NPSHR, with a minimum of 3 ft or about 1 m, potentially increasing to 50% of NPSHR for severe transient/high-energy cases. These examples are preserved here alongside the earlier NPSH explanation. Use the applicable margin guideline and manufacturer requirements for final selection; these figures are not universal acceptance rules.
Choosing the number of pump stages
Stage count is a hydraulic selection decision: match the required head without sacrificing suction performance or attainable efficiency.
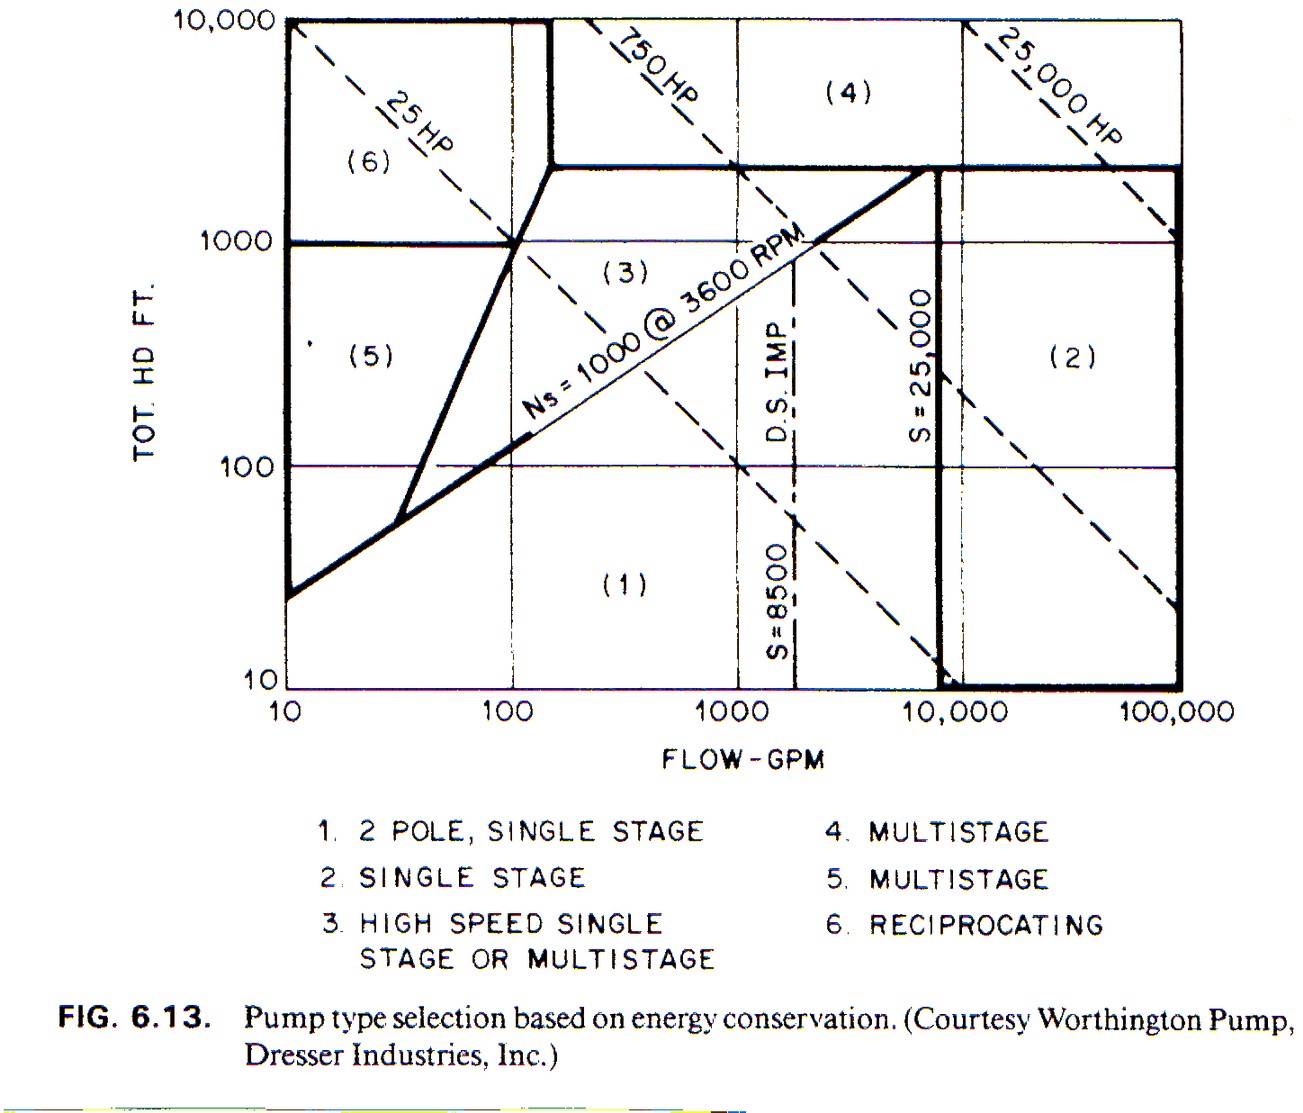
The source gives two historical US-specific-speed screening rules: Ns above 500, and above 1,000 when energy consumption is a major concern. These are design heuristics from the teaching material, not universal requirements for all centrifugal pumps. Evaluate the candidate's actual efficiency, duty range and construction.
At fixed flow and speed, increasing head per stage reduces Ns. The presentation considers two ways of increasing Ns or preventing it from becoming too low:
- Increase rotational speed. This can raise specific speed, but the resulting suction requirement can also increase. Since the system cannot always supply additional NPSHA, acceptable NPSHR and the actual suction margin constrain this approach. Recalculate the indices and review the manufacturer's curves rather than assuming that speed alone improves the selection.
- Reduce the head developed by each stage. Distribute the required total head over several stages in a multistage pump, or over pumps operating in series. The source describes this as reducing head per eye; use head per stage consistently in the Ns equation. Verify first-stage suction performance and downstream pressure containment.
The target is a pump arrangement with suitable efficiency and acceptable suction performance. The original selection map below relates head and flow to candidate arrangements; it illustrates the trade-off between energy consumption and suction requirements rather than specifying a guaranteed selection.
Operating capacity and hydraulic stability
The actual duty belongs to the combined installation, not to the pump curve alone.
Operating capacity when suction performance changes
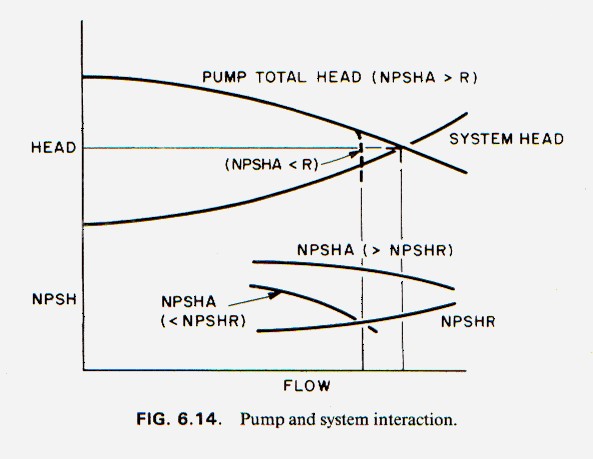
The operating flow is determined by the intersection of the pump head curve and the system head curve. Available suction head must satisfy the manufacturer's requirement with the appropriate service margin throughout the expected range.
If NPSHA falls below the required value, cavitation can reduce the head actually developed. The operating point still depends on the intersection of the system curve and the degraded pump curve; it no longer necessarily lies on the unaffected catalog curve. The original figure shows both the pump/system intersection and the available/required NPSH relationship.
A distinct, stable intersection
The presentation describes a clear, unique intersection as the desired operating condition. A continuously rising system curve intersecting a continuously falling pump curve is a common way to achieve it. Stability comes from the interaction of the two curves, rather than from the pump in isolation.
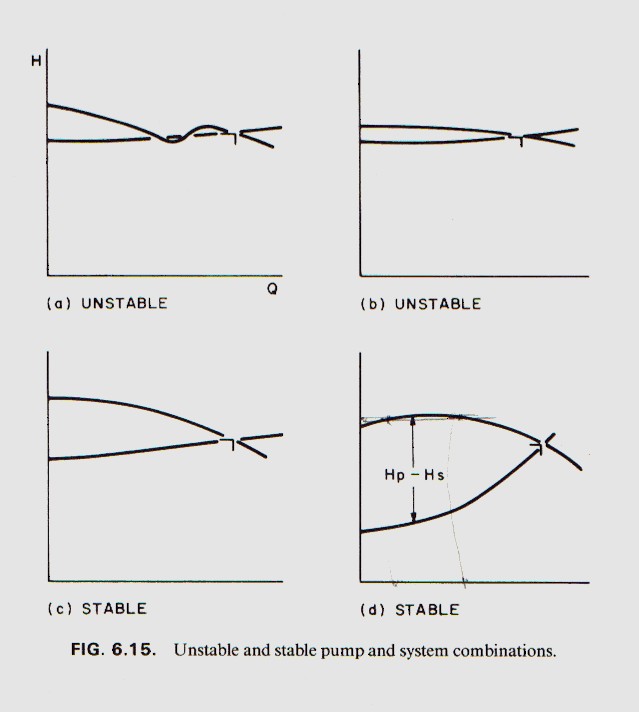
Head separation and controllability
Across the intended operating range, the relationship between pump head and system head must provide usable control authority. At the steady operating point the heads are equal; away from it, their relative slopes and separation determine how an adjustment in resistance or speed changes flow.
A drooping pump characteristic can form a stable system when paired with a suitable system curve. Conversely, multiple intersections or a poorly defined intersection require additional review of branch stability, valve behavior, operating transitions and the control strategy. This is why the original lesson asks the engineer to assess the complete installation.
How Centrifugal Pump Construction Changes the Selection
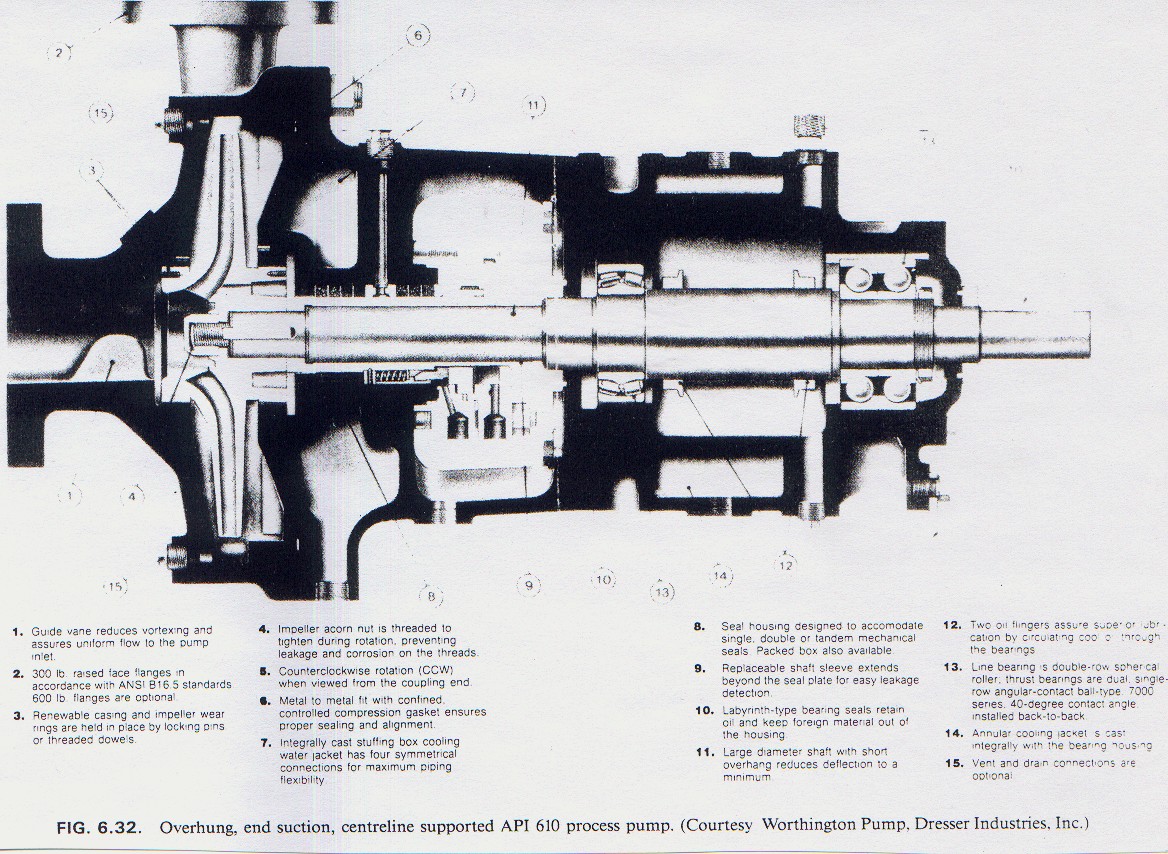
The same flow and head can be produced by different mechanical arrangements. Petropedam's original training material illustrates horizontal and vertical shafts, single and multistage hydraulics, separate or close-coupled drivers, and different seal and bearing layouts. A hydraulic duty alone does not choose among them.
Overhung impeller (OH)
An impeller outside the bearing span gives a comparatively compact arrangement. Evaluate shaft deflection, seal environment, driver coupling, piping loads and temperature for the selected configuration. Horizontal or vertical orientation does not by itself establish API compliance.
Impeller between bearings (BB)
Bearings support the rotor on both sides of the impeller or stages. Consider casing split, suction arrangement, axial thrust, seal access and the specific hydraulic duty. A double-suction design can reduce inlet velocity for a given total flow, but the actual NPSH characteristic must still be verified.
Vertical suspended construction (VS)
A suspended wet end can serve sumps, pits and deep liquid levels. Verify setting depth, minimum submergence, suction flow pattern, column losses, bearing lubrication and installation clearance. A submersible motor is a different architecture; do not identify every immersed pump as an API VS type.
Arrangement drawing, certified duty curves, NPSH data, seal plan, materials, rotor and bearing design, minimum-flow limit, allowable nozzle loads, installation envelope and the standard specified in the purchase documents.
Engineering basis: Petropedam training material; Hydraulic Institute pump-type definitions. The figures above are conceptual, not certified Petropedam product drawings.
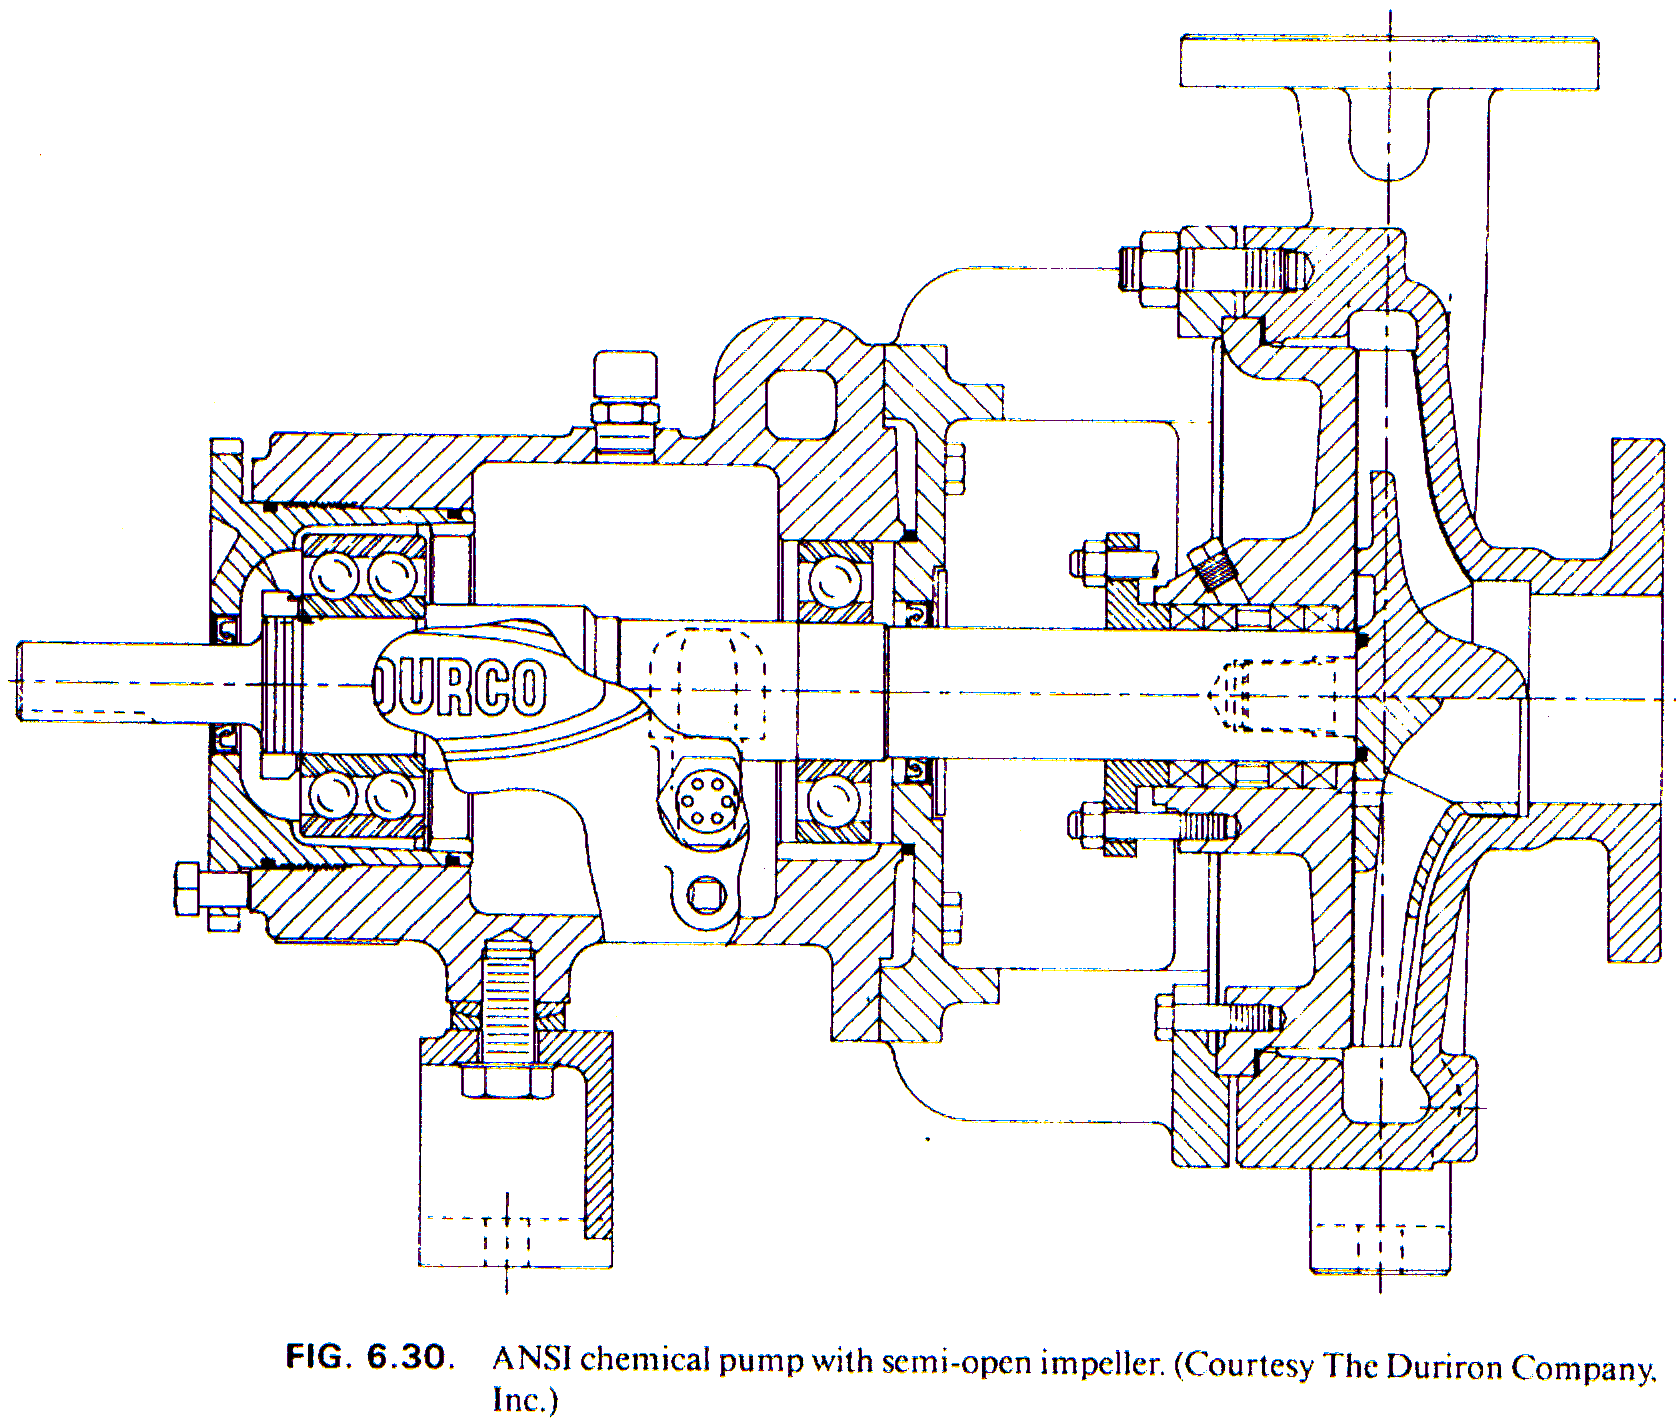
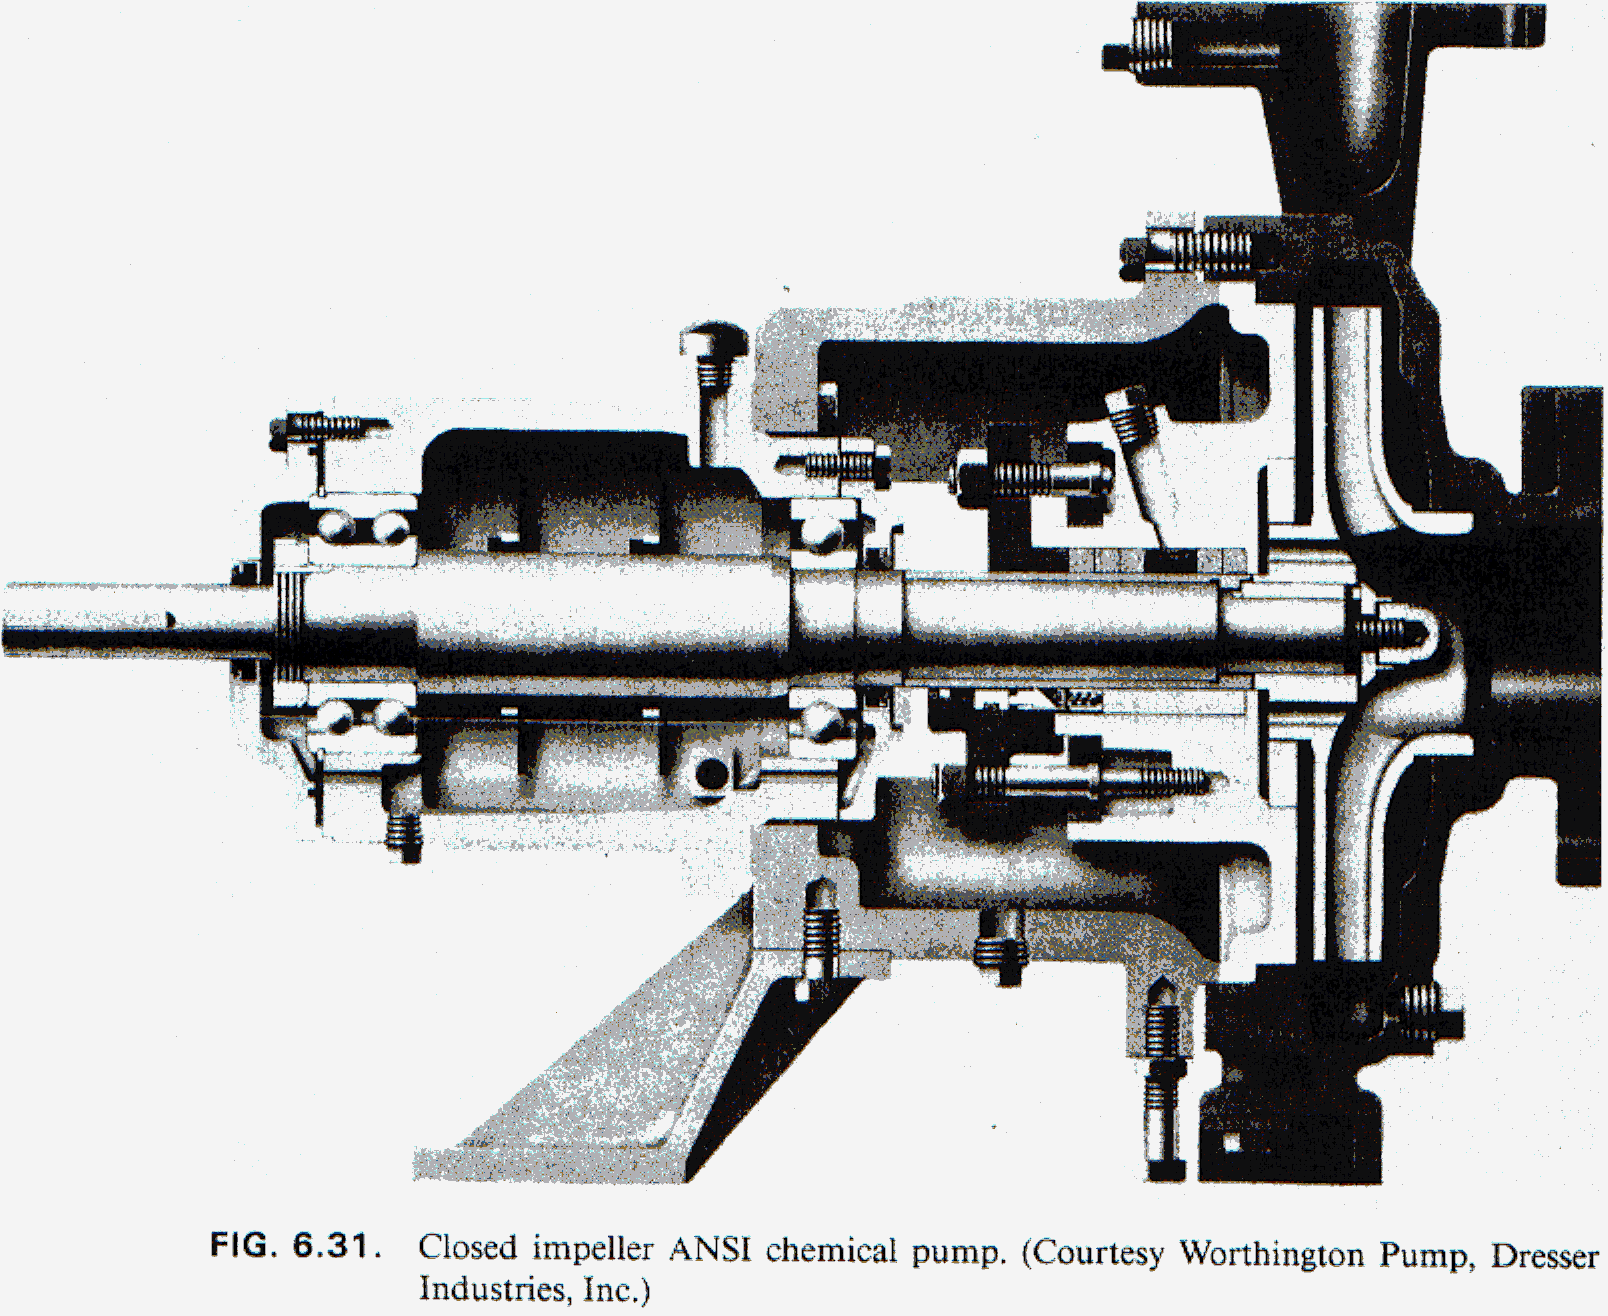
Reading the original chemical-process pump constructions
The following source figures show classifications, impeller sections and driver arrangements. Read the suction path, impeller, shaft, casing and driver relationship in each drawing. These historical illustrations teach construction; their embedded ANSI references and supplier credits do not establish current product certification.
Sealed, seal-less and special designs
| Source group | Construction |
|---|---|
| Sealed |
|
| Seal-less |
|
| Special designs |
|
The chart's sealed/seal-less grouping belongs to its original terminology. In selection, identify the actual shaft-sealing or containment arrangement rather than inferring zero leakage from a category name.
Open-impeller chemical-process pump
Closed-impeller chemical-process pump
Construction and dimensional reference
Vertical inline motor arrangements
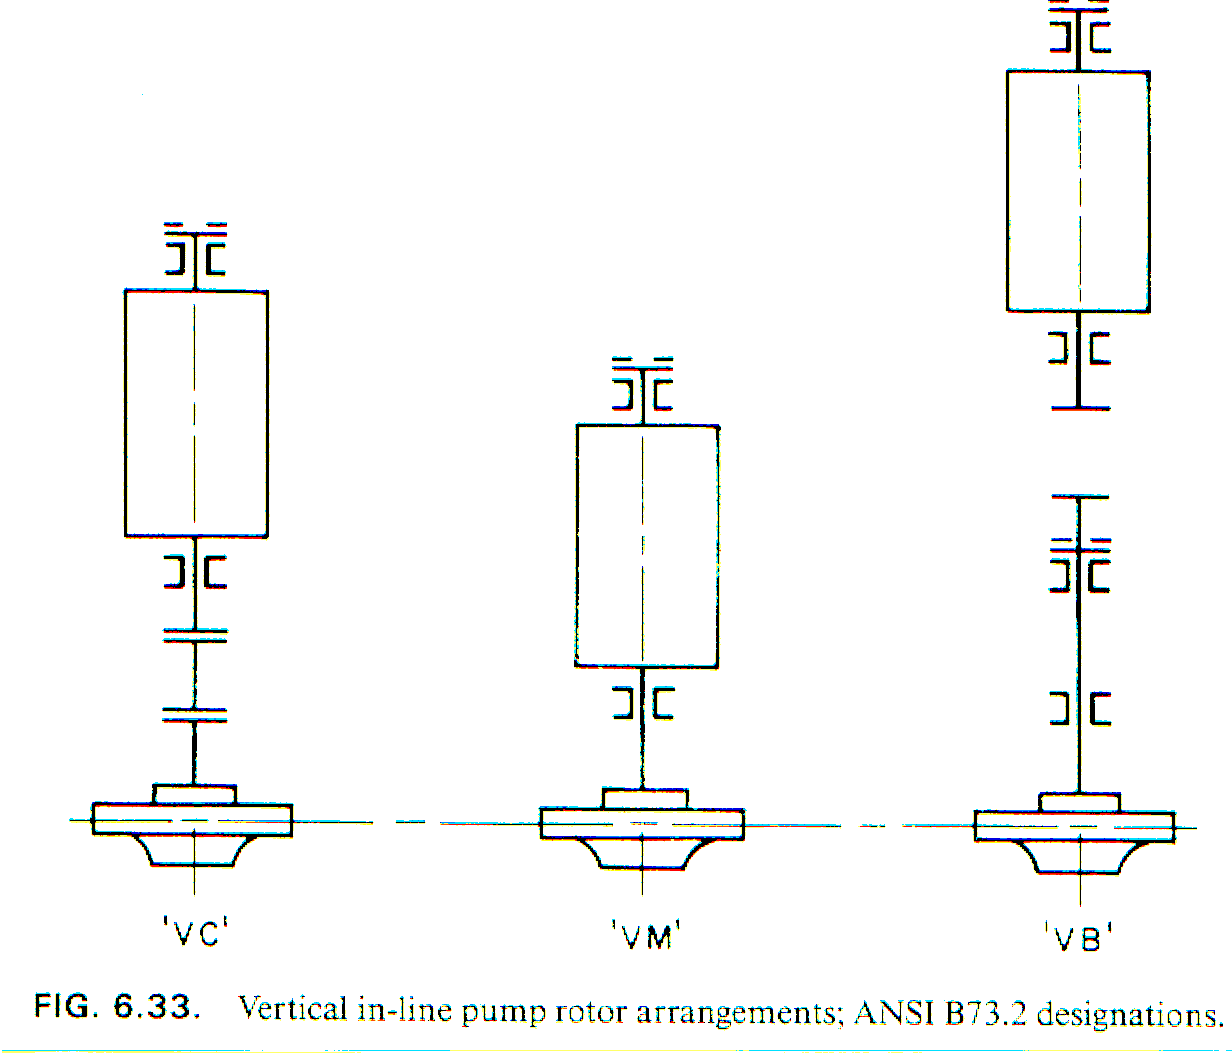
OH3, OH4 and OH5: identify the shaft and coupling arrangement
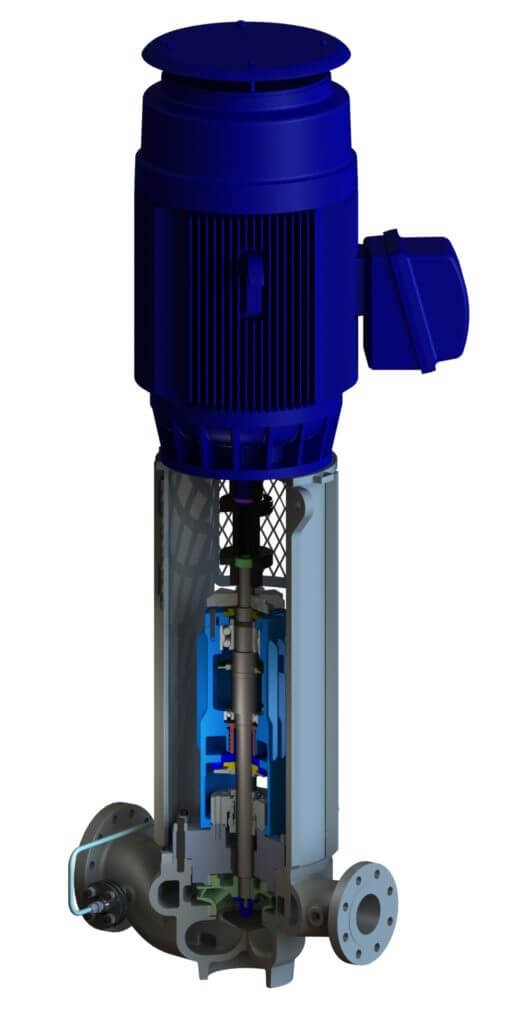
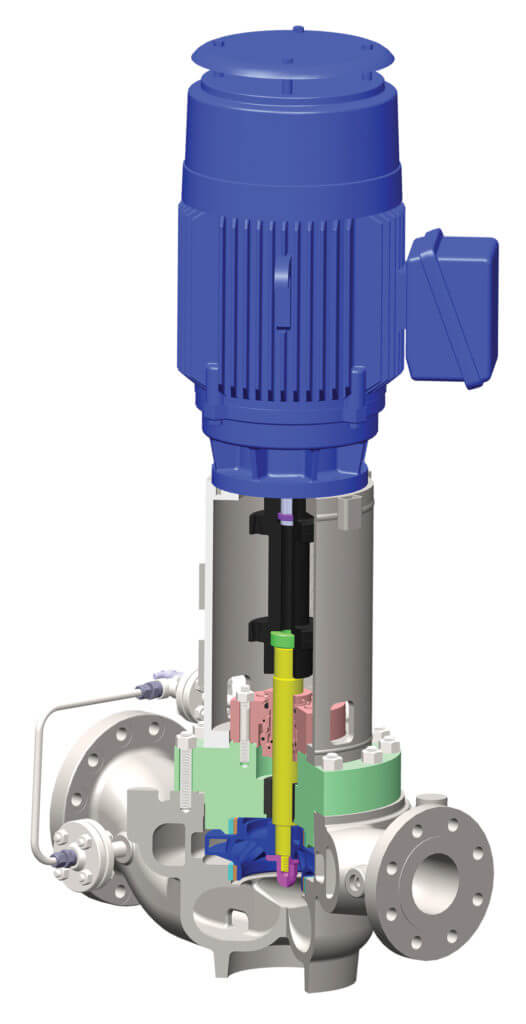
All three types are vertical inline, single-stage overhung arrangements. The distinction is how the pump shaft connects to the motor and which bearings support it. Compare the cutaways below with the preceding source arrangement chart.
OH3 — separate pump bearings and a flexible coupling
OH4 — rigidly coupled
OH5 — close coupled
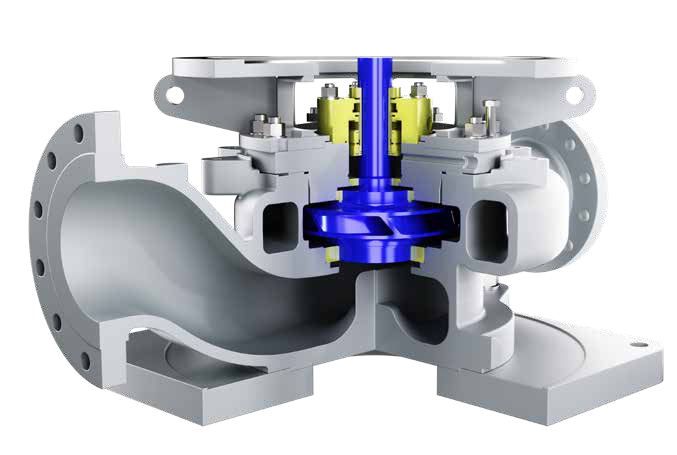
These credited manufacturer illustrations explain construction and are not Petropedam product photographs. The original historical drawings remain available: rigid coupling, external inline view, and separately coupled VB section. Verify the specified API class and compliance against the actual supplied design.
For a quotation, request the specific arrangement drawing, current dimensions, duty curves, seal/containment details, allowable nozzle loads and installation/maintenance clearances.
Slurry liners, wear plates and construction
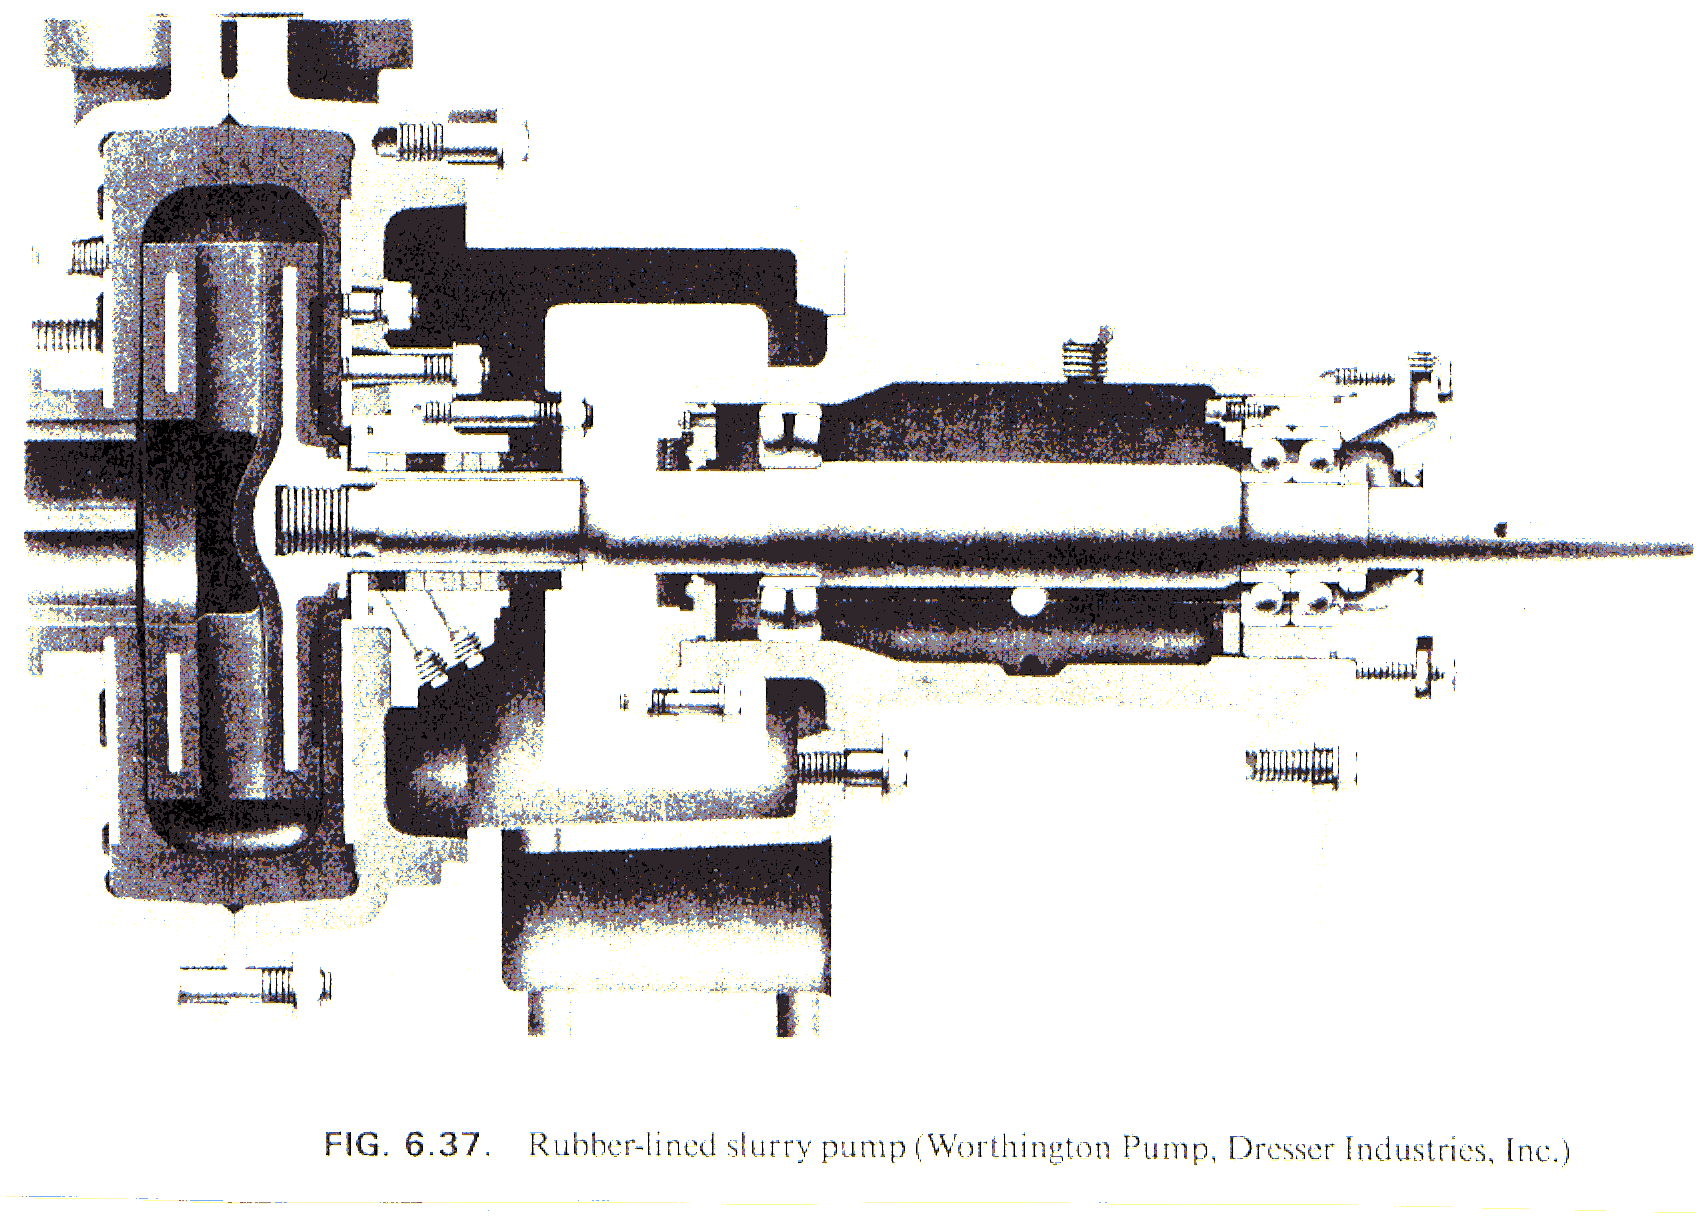
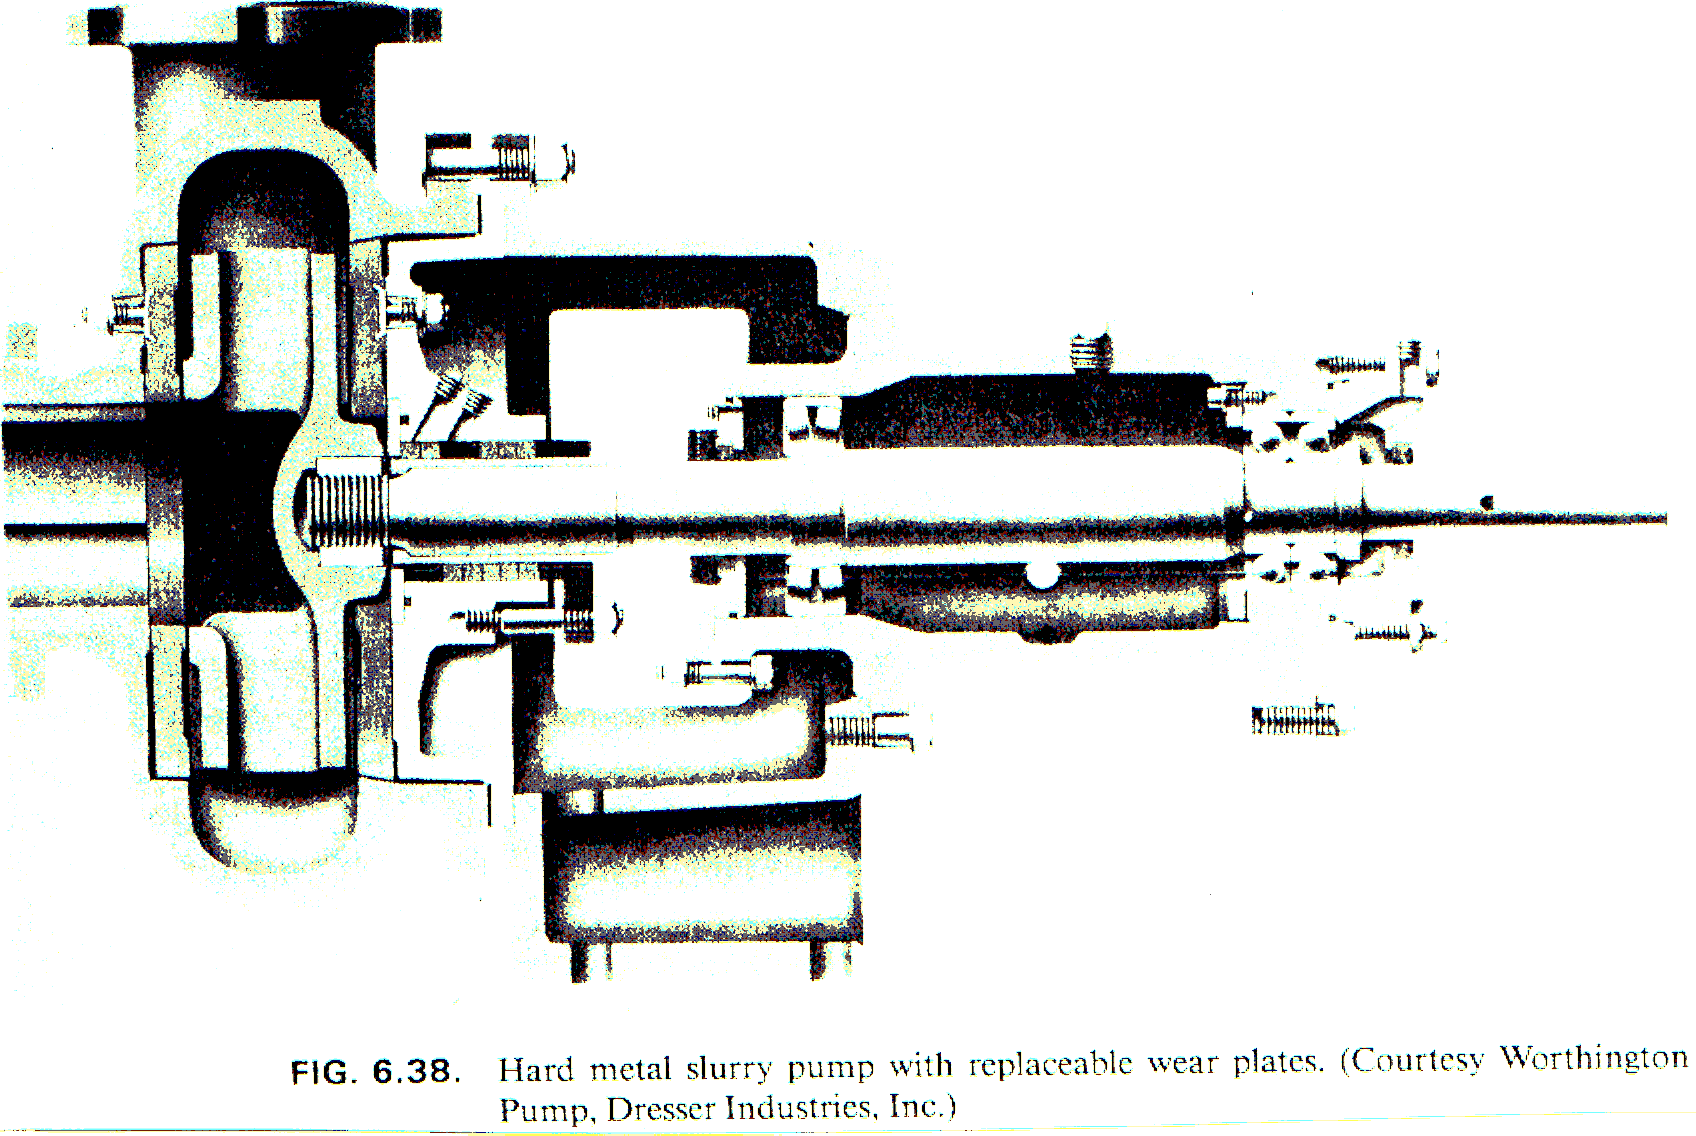
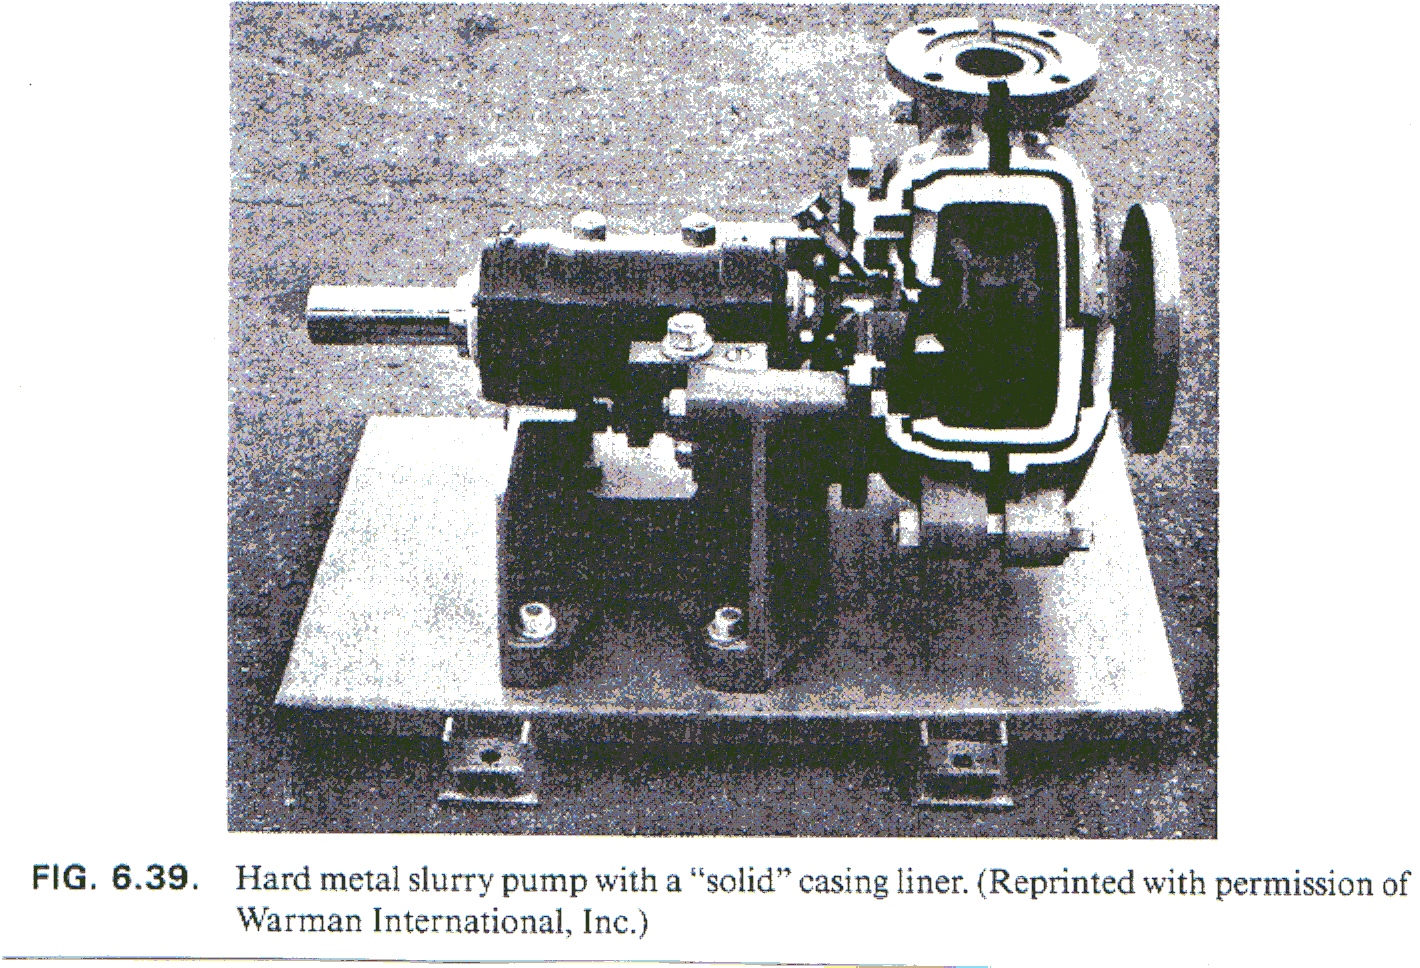
These original sections show how the wetted construction changes for solids handling. Follow the impeller, casing liner, wear surfaces, shaft and bearings rather than identifying a material from its colour.
Rubber-lined slurry pump
Hard-metal slurry pump with replaceable wear plates
Hard-metal slurry pump with a solid casing liner
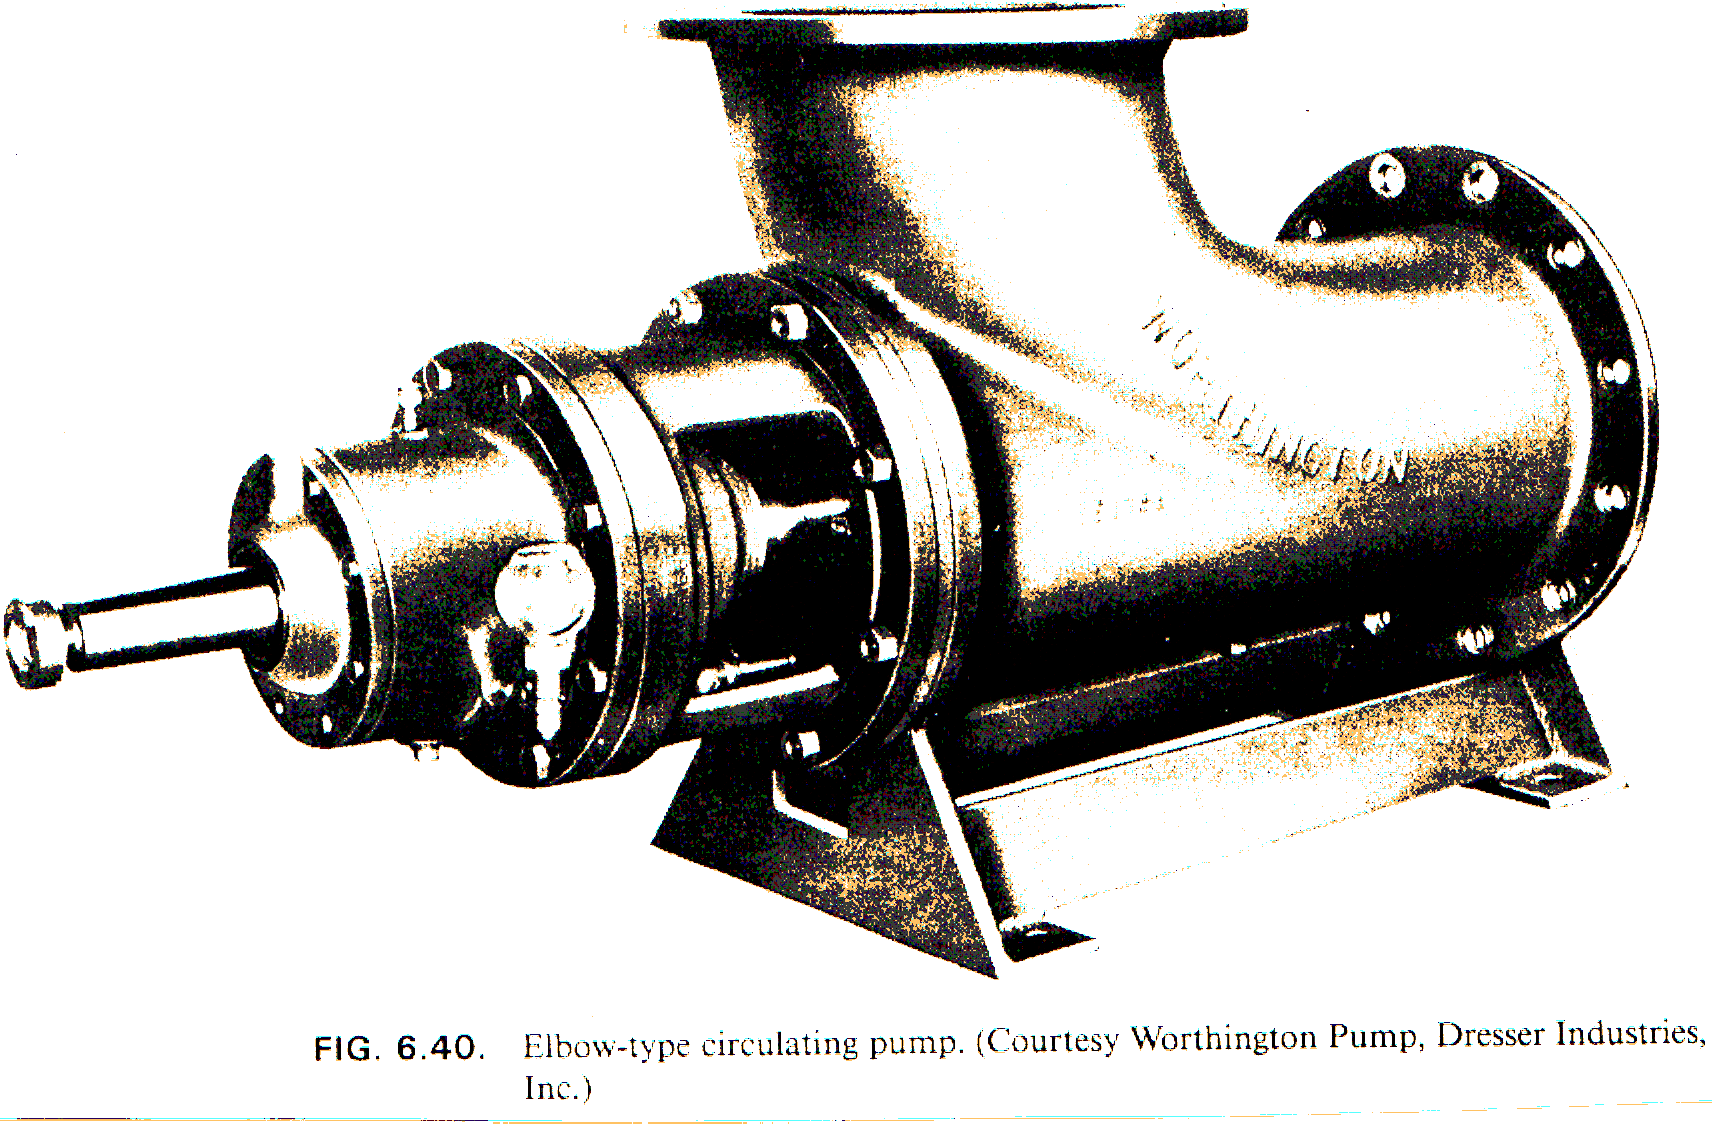
circulating pump
Between-bearings and multistage casing arrangements
Single-stage, radially split, double-suction volute pump
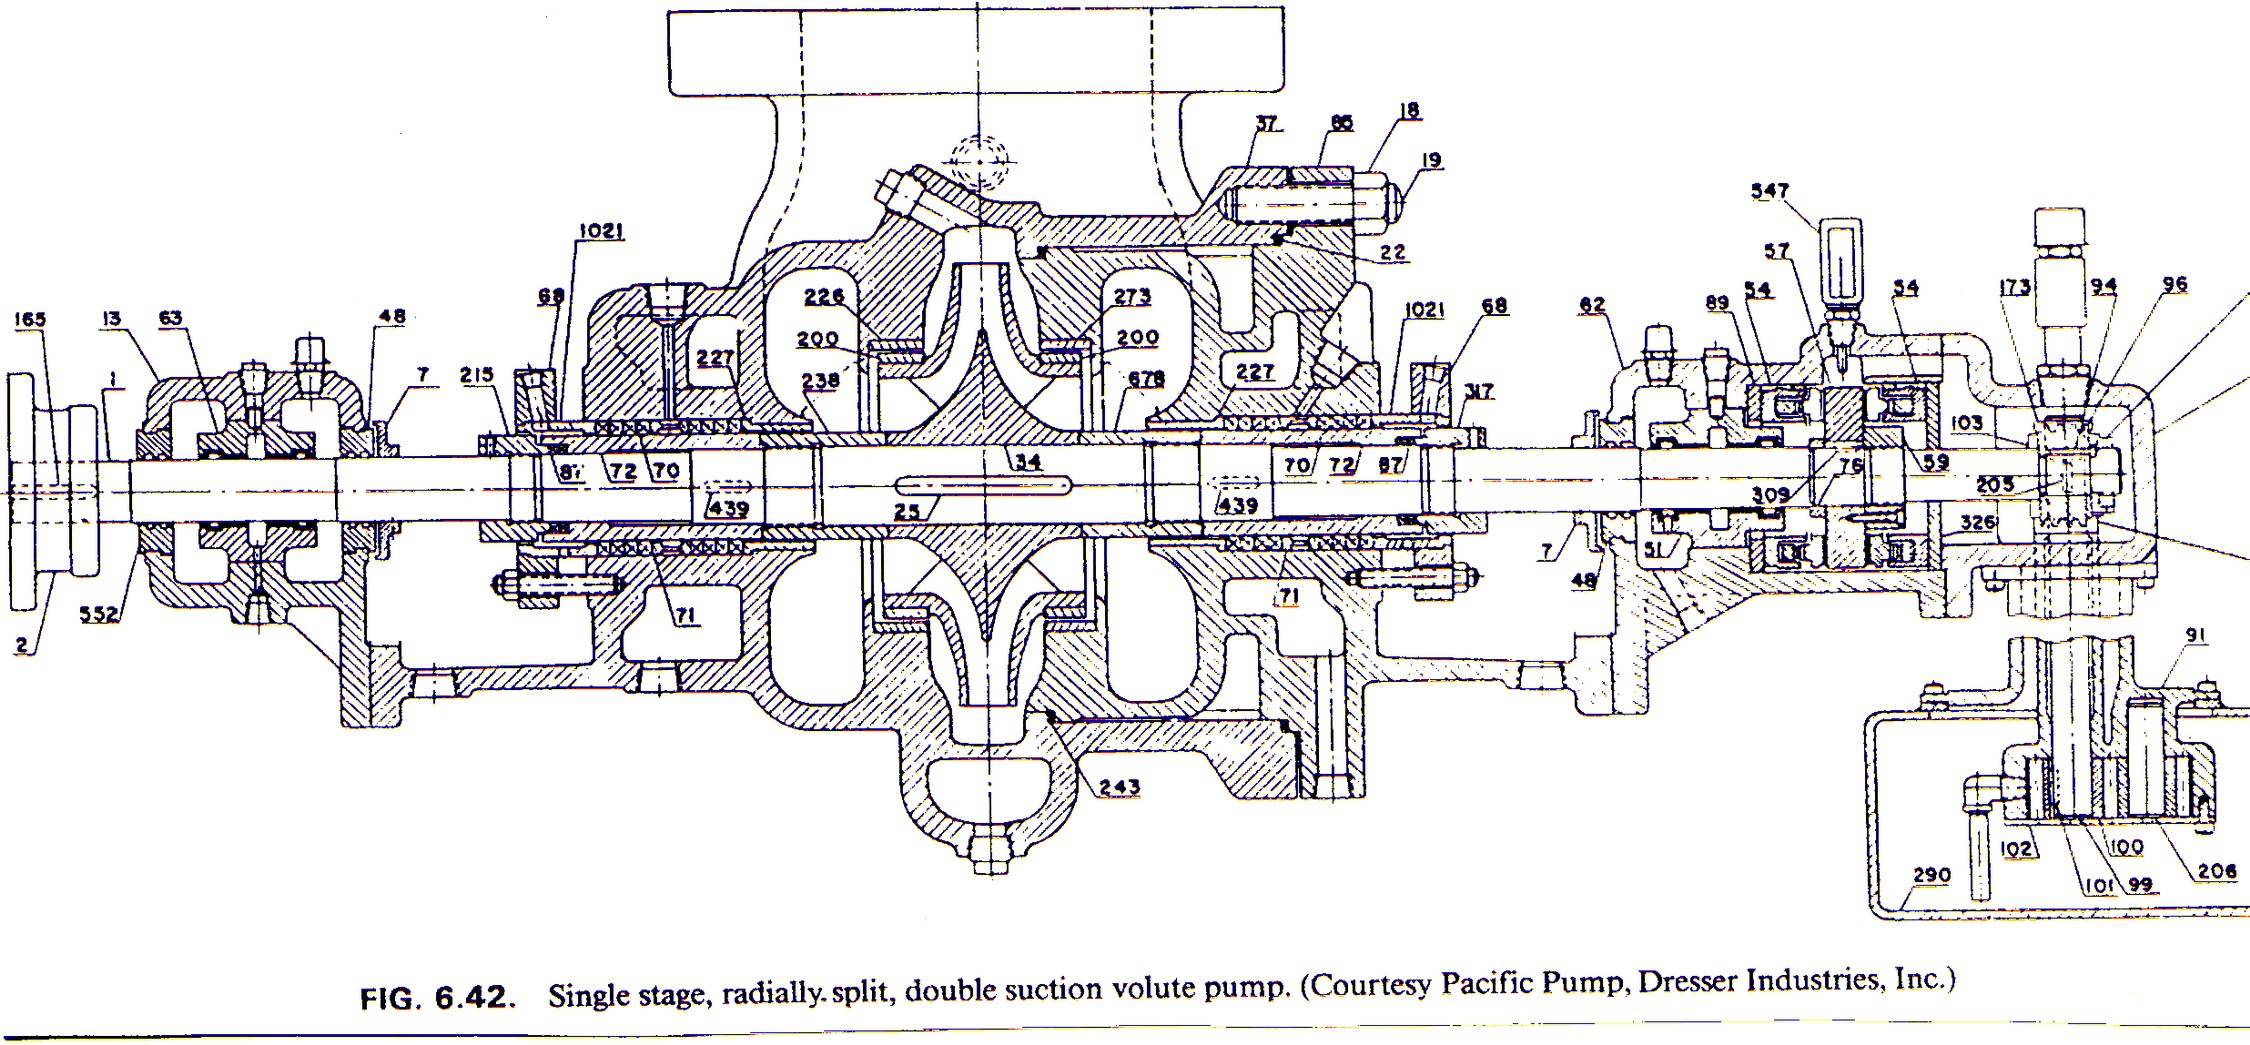
Multistage configurations and thrust balance
The source table compares horizontal and vertical casing arrangements with tandem or opposed impellers. U means usual; A means available; a dash is the source table’s unmarked entry, not a universal prohibition. This is a historical configuration comparison, not a current availability guarantee.
| Impellers | Thrust balance | Horizontal segment | Horizontal axial split | Horizontal barrel | Vertical segment | Vertical can |
|---|---|---|---|---|---|---|
| Tandem | None | — | — | — | — | U |
| Tandem | Individual | U | — | — | — | A |
| Tandem | Balancing device | U | A | U | U | — |
| Opposed | Opposed impellers | A | U | A | — | — |
View the original configuration table.
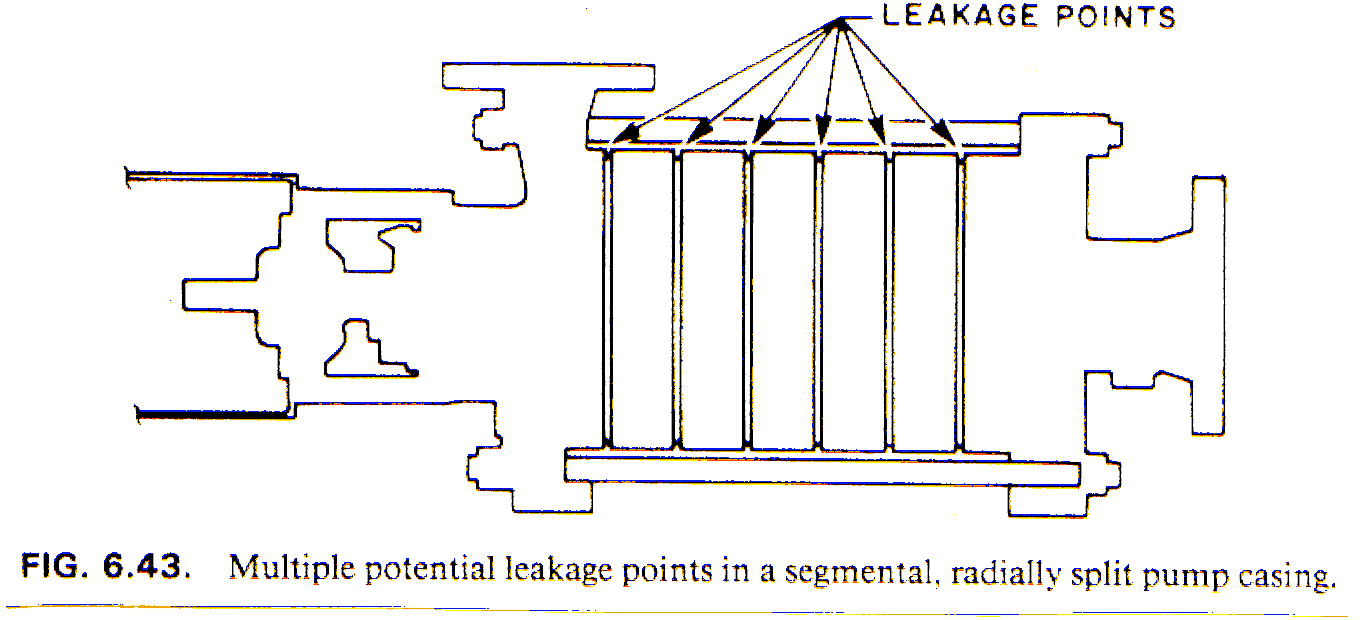
Segmental casing: multiple potential leakage points
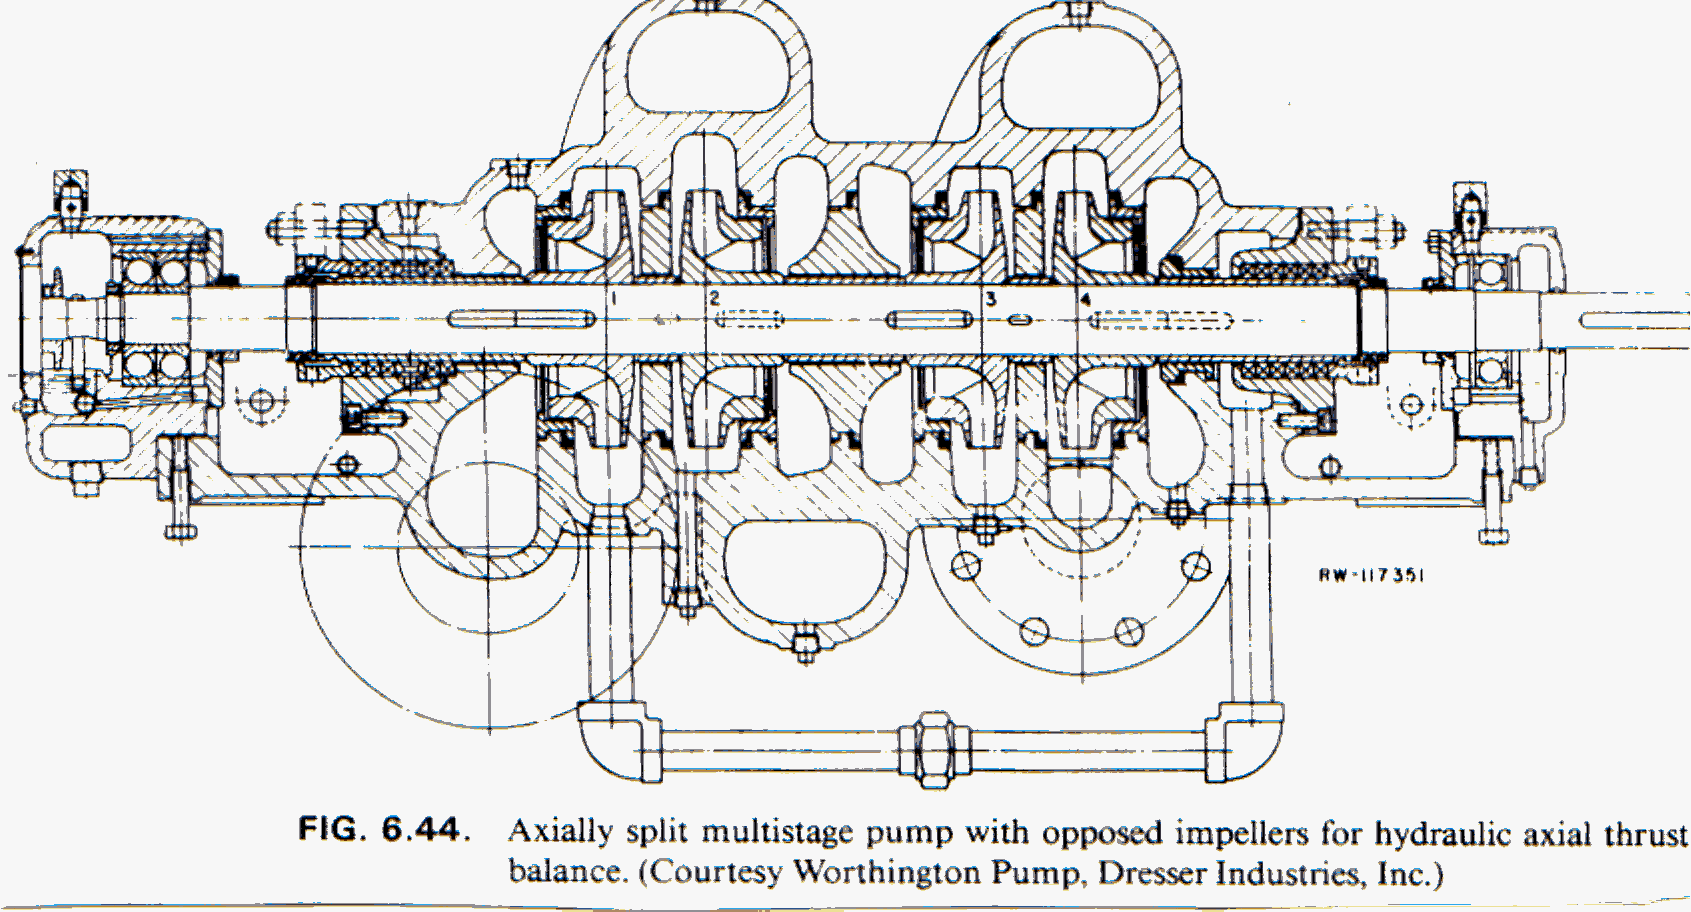
Axially split multistage pump with opposed impellers
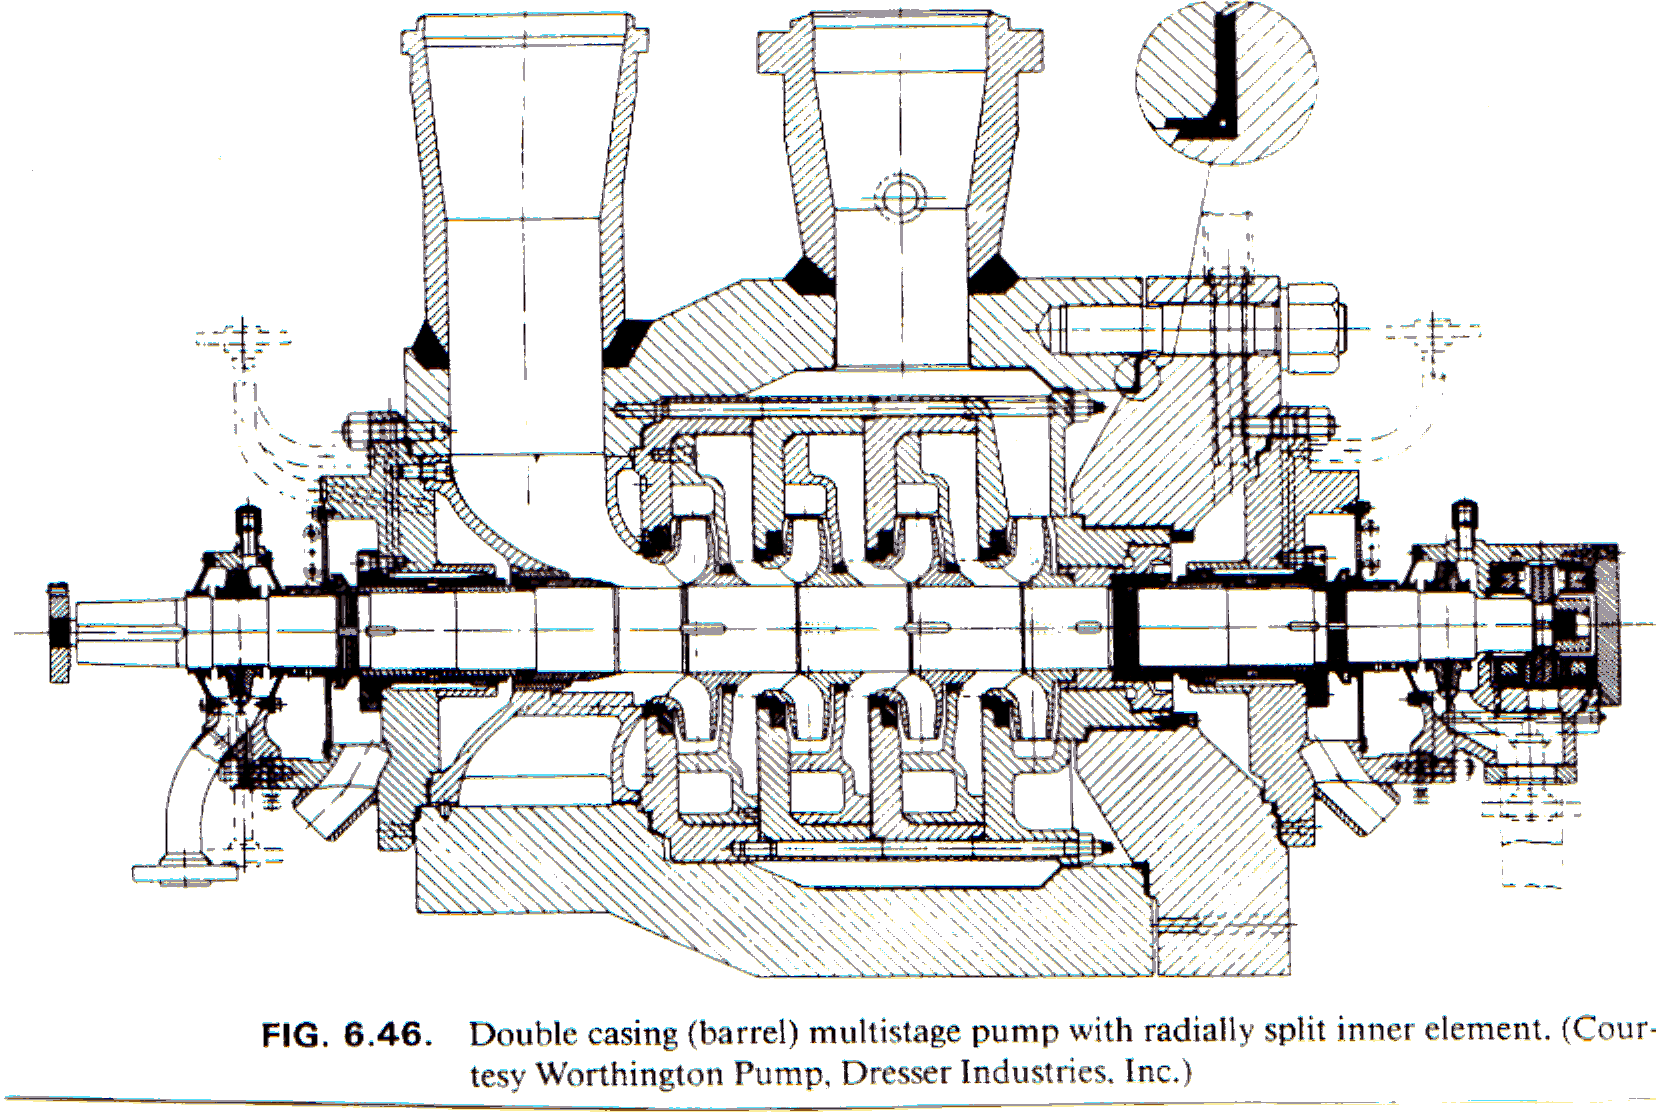
Double-casing barrel pump with a radially split inner element
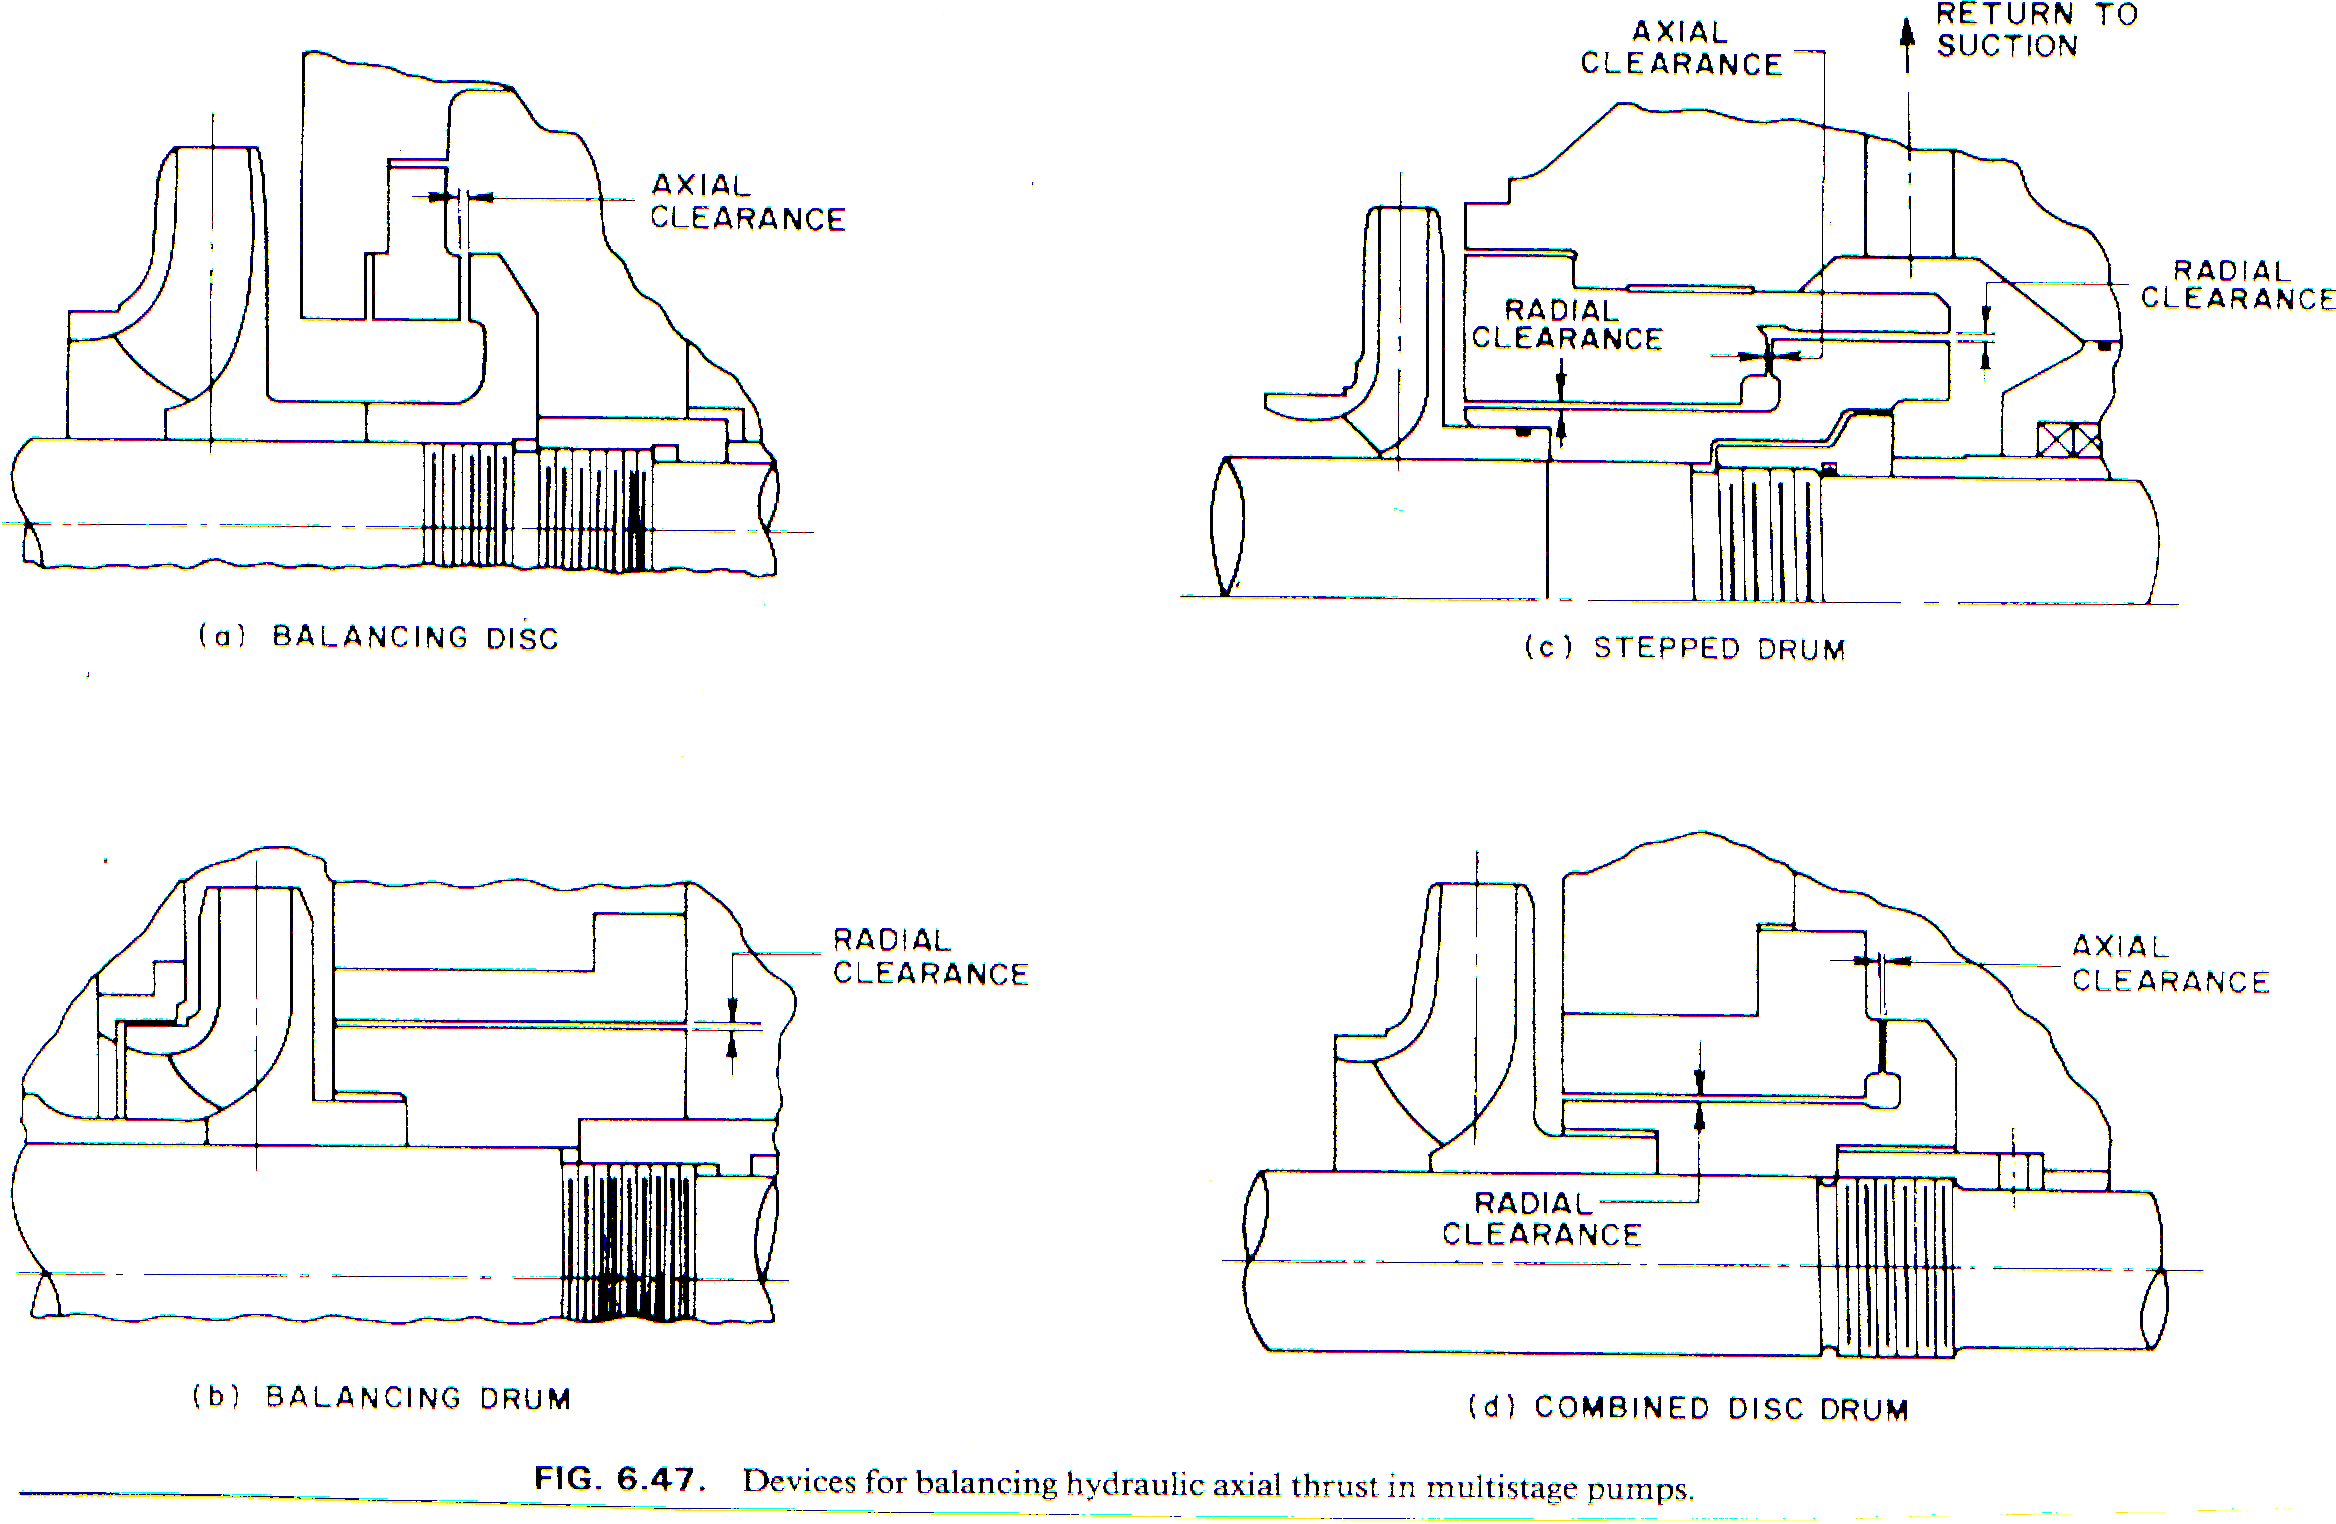
Axial-thrust balancing devices
Rotor stiffness and maximum running speed
Two pumps with the same hydraulic duty can have different rotor behaviour. The original guidance chart relates a shaft-stiffness parameter to maximum running speed for between-bearings rotors. Read the shaft span, mean diameter and rotor weight together; a long, slender rotor is more sensitive to imbalance, initial straightness and internal-clearance wear.
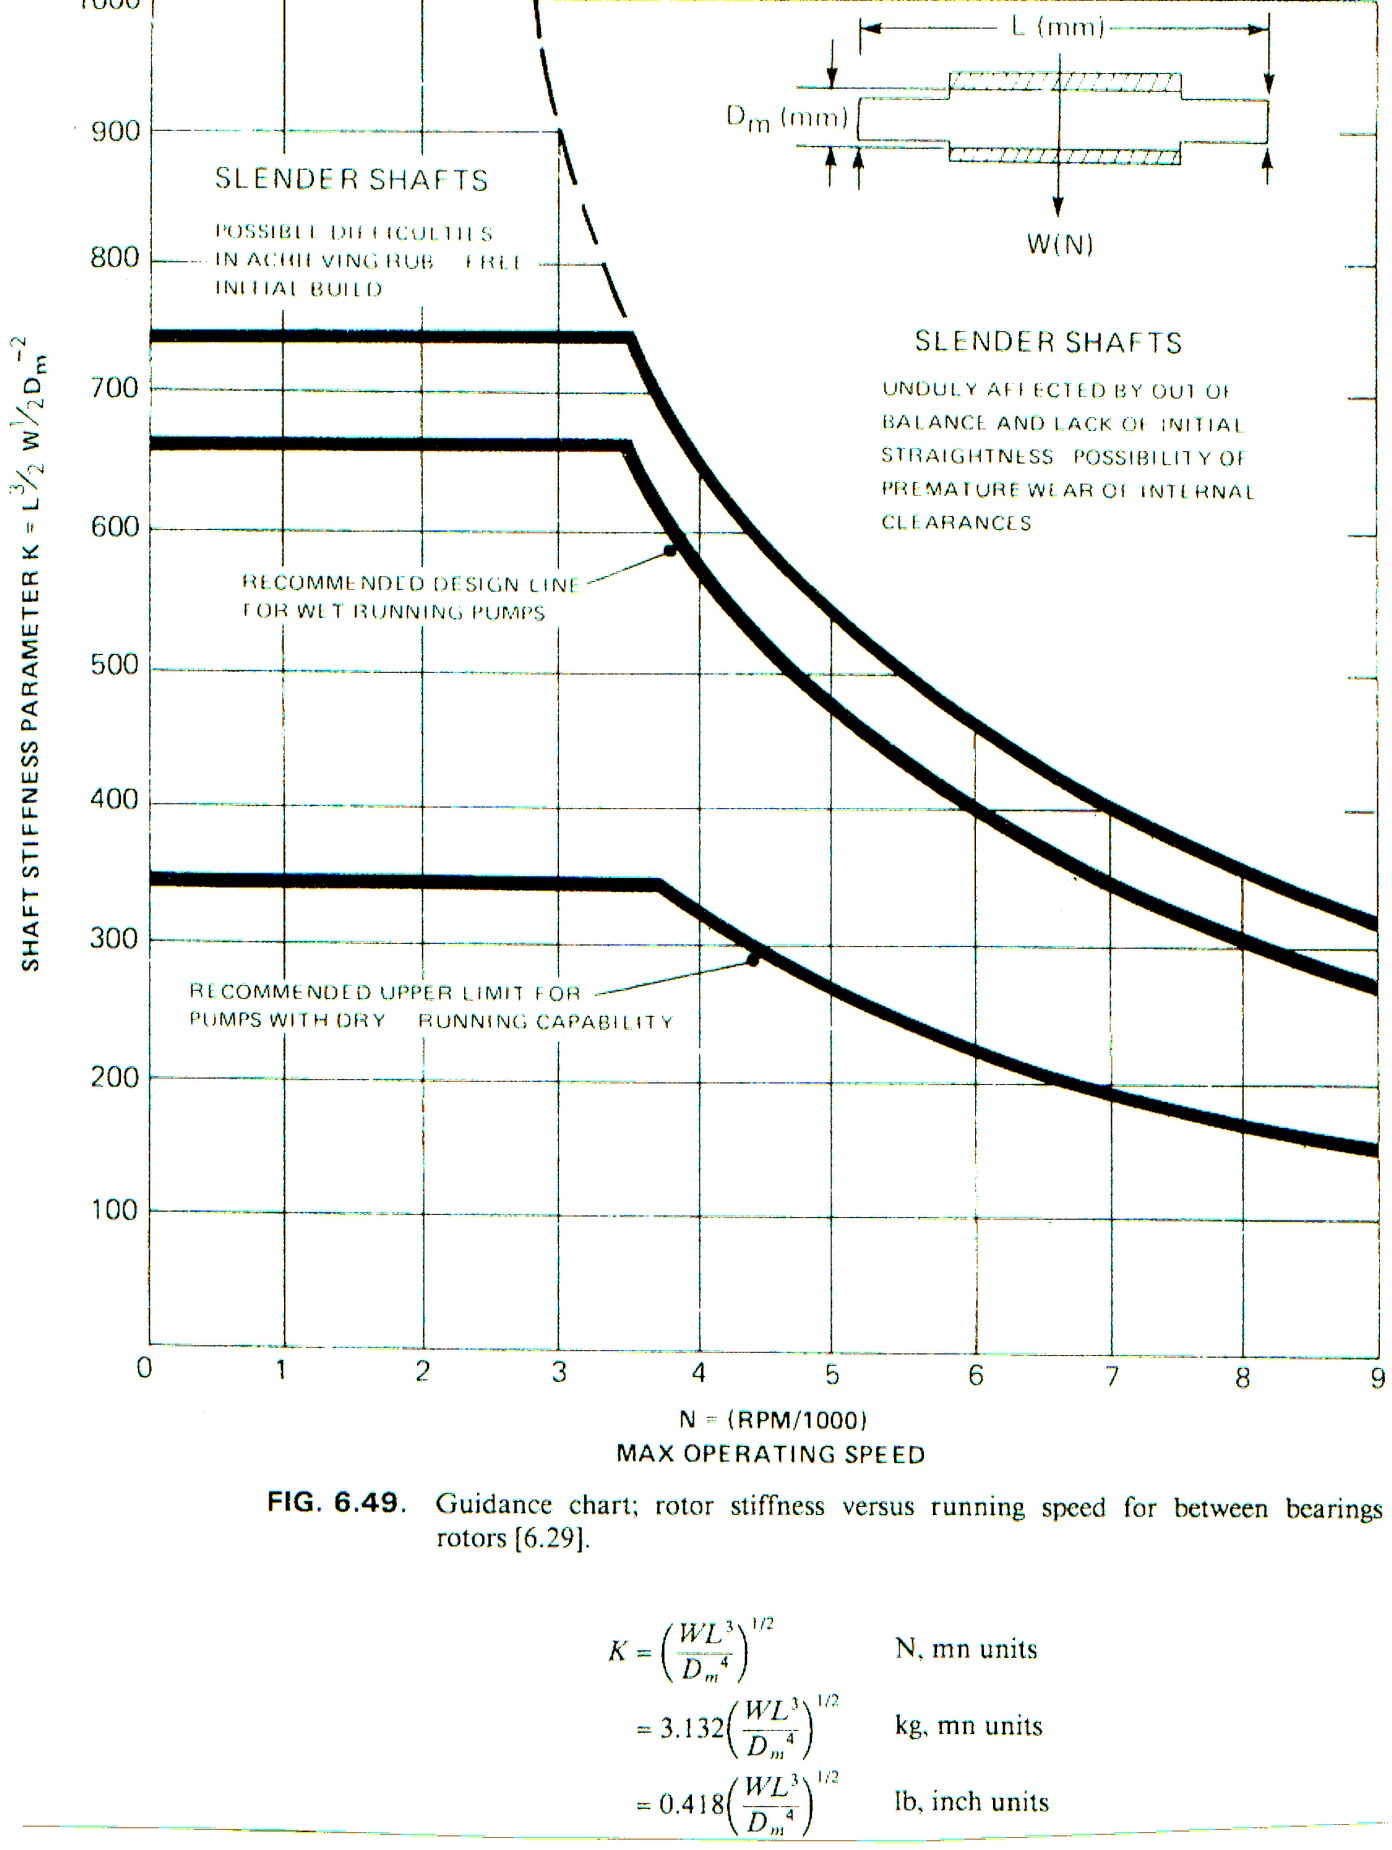
In the source’s N/mm convention, W is rotor weight in newtons, L is the bearing span in millimetres, and Dm is the mean shaft diameter in millimetres. The source also prints factors of 3.132 for kg/mm and 0.418 for lb/in. Use the matching weight/mass and length convention; K is the source’s index, not a dimensionless number or stiffness in N/m. This screening chart does not replace a rotor-dynamic analysis, critical-speed separation review or manufacturer evaluation.
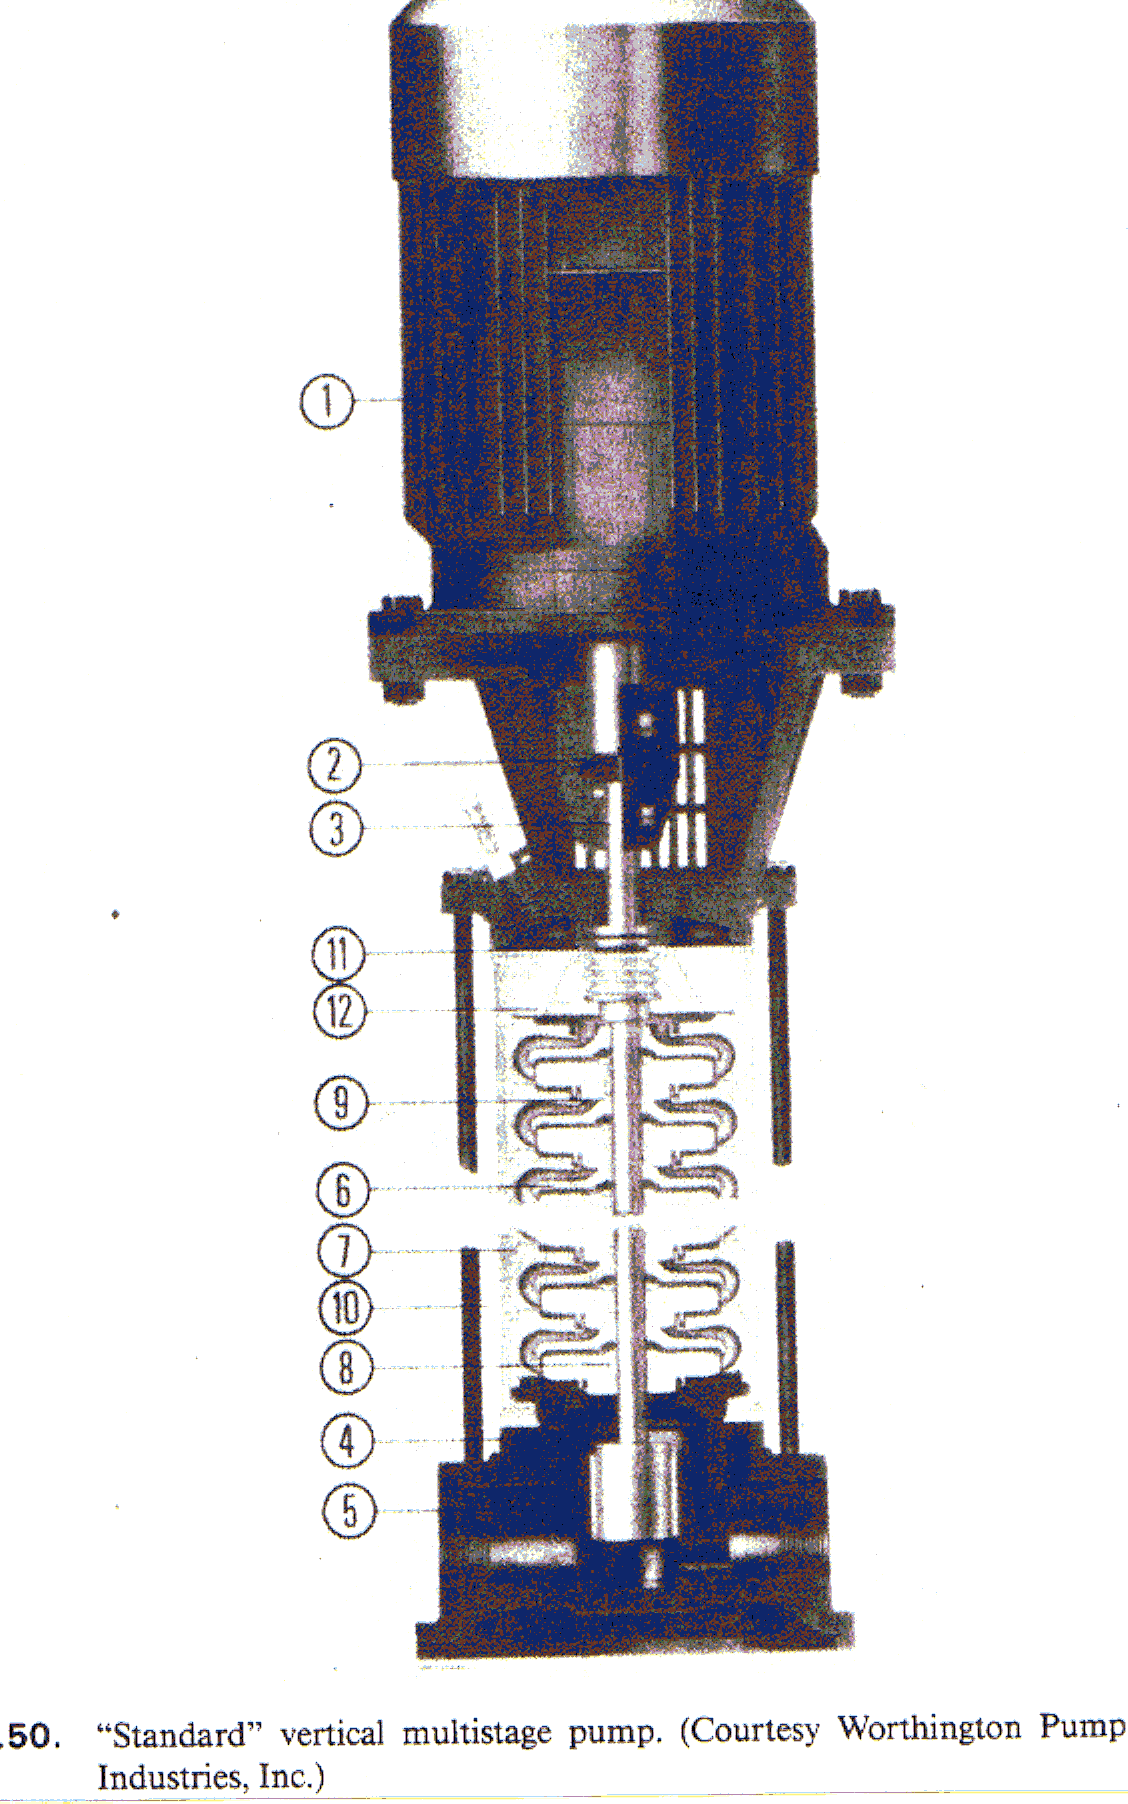
Vertical multistage pumps: trace the stages and thrust path
Standard vertical multistage construction
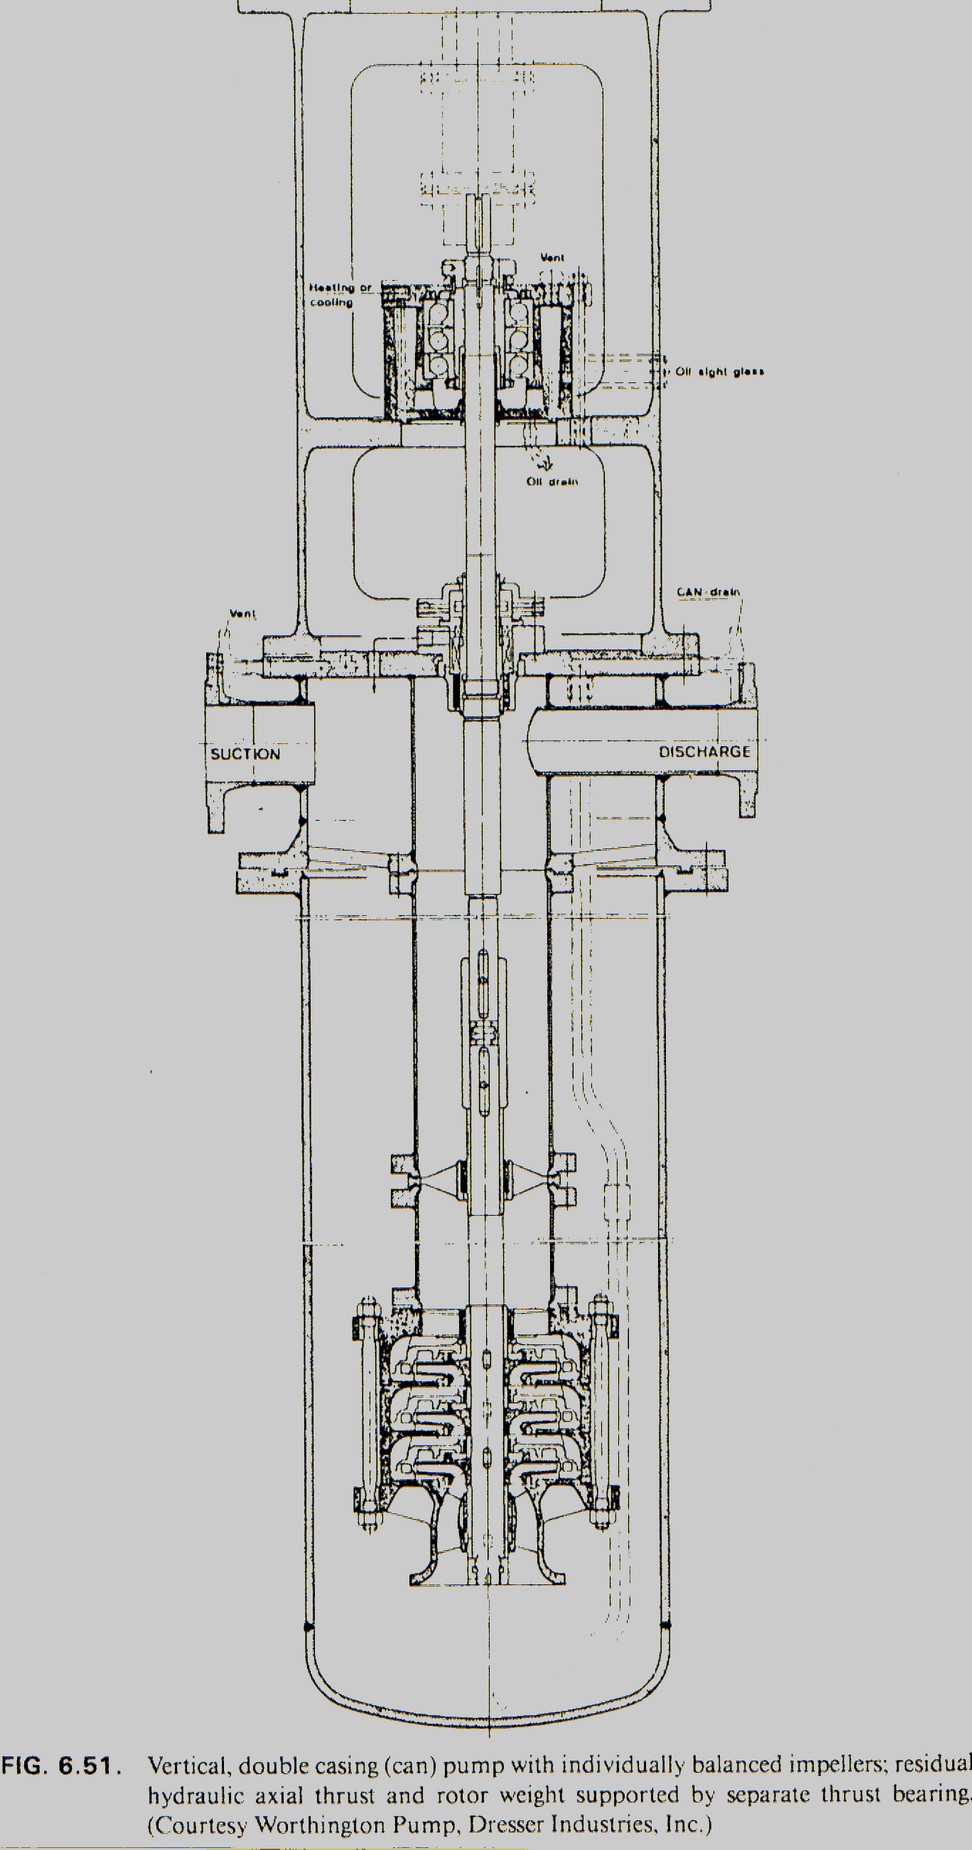
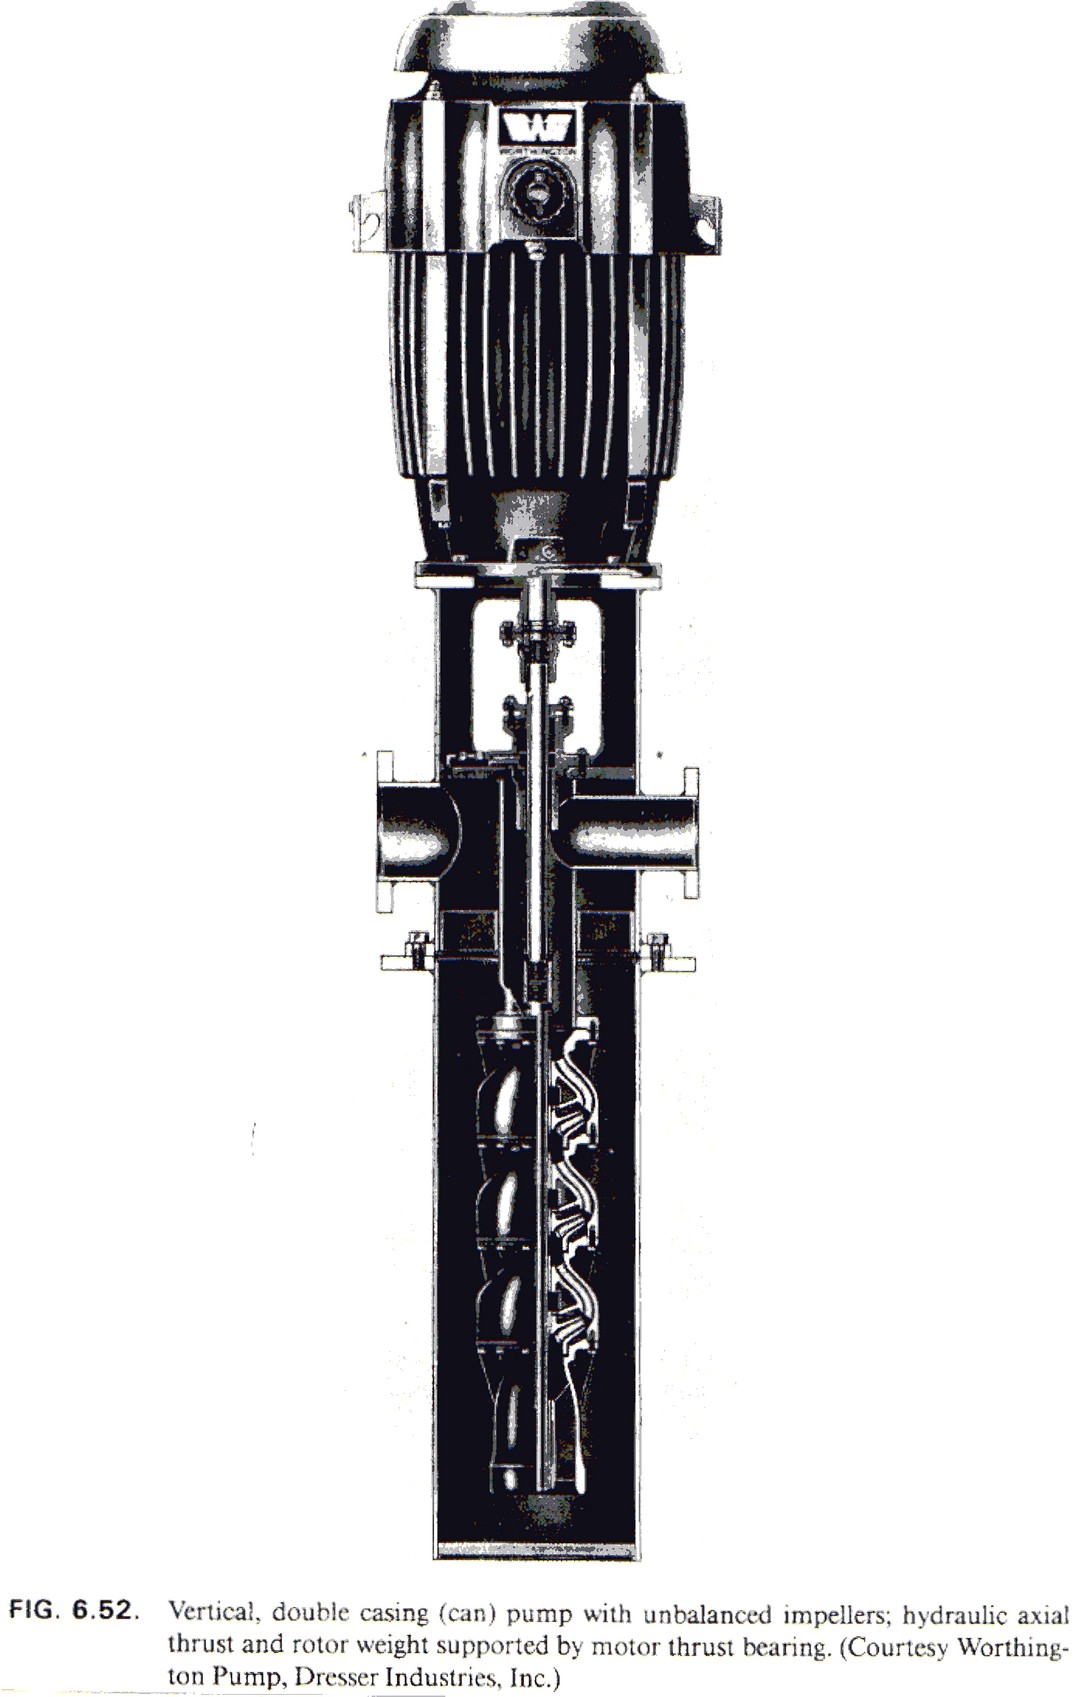
Vertical double-casing can pump
A can surrounds the submerged hydraulic assembly and connects it to the suction arrangement. The thrust load has to be carried by a specified bearing, either in the pump assembly or in the motor. The original examples below distinguish these two load paths.
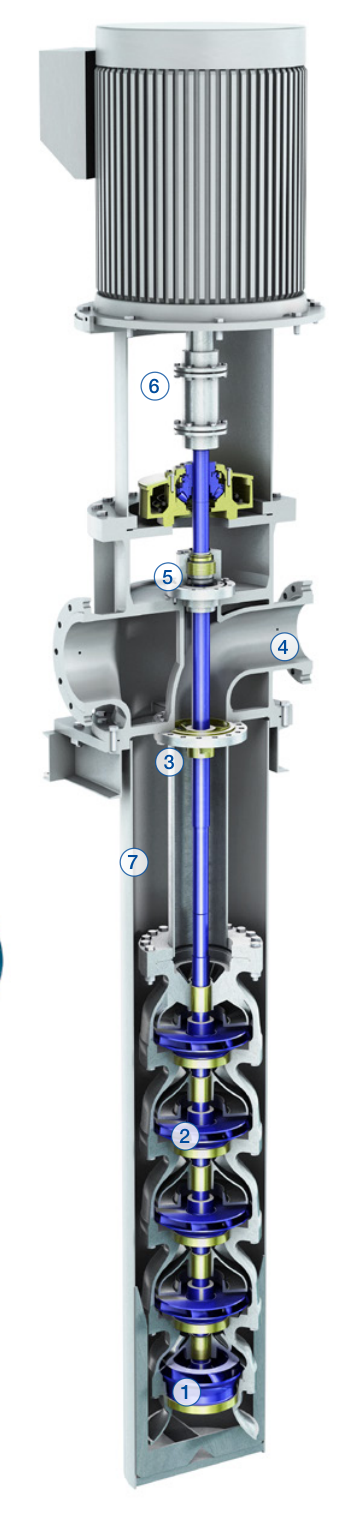
| Impeller arrangement | Load carried | Thrust support |
|---|---|---|
| Individually balanced impellers | Residual hydraulic axial thrust and rotor weight | Separate pump thrust bearing |
| Unbalanced impellers | Hydraulic axial thrust and rotor weight | Motor thrust bearing |
View the original section with separate thrust bearing
High-speed single-stage pumps with integral gearing
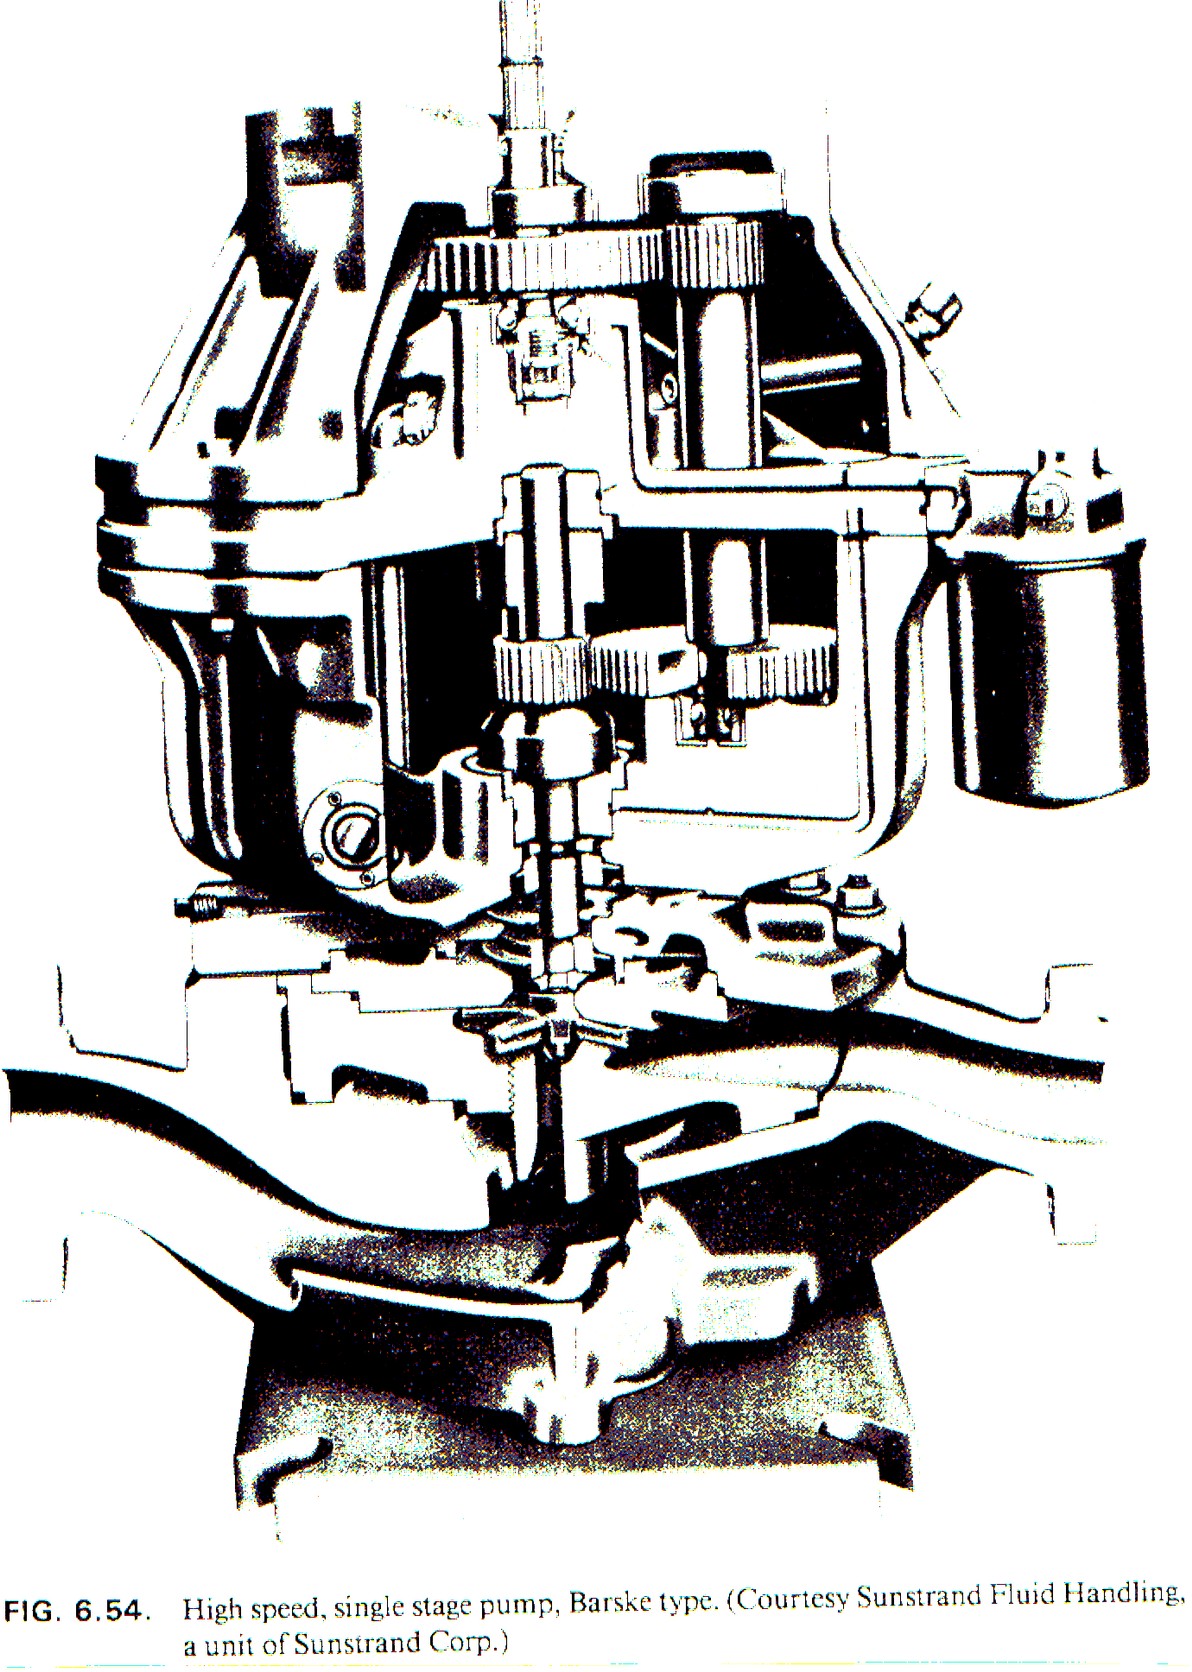
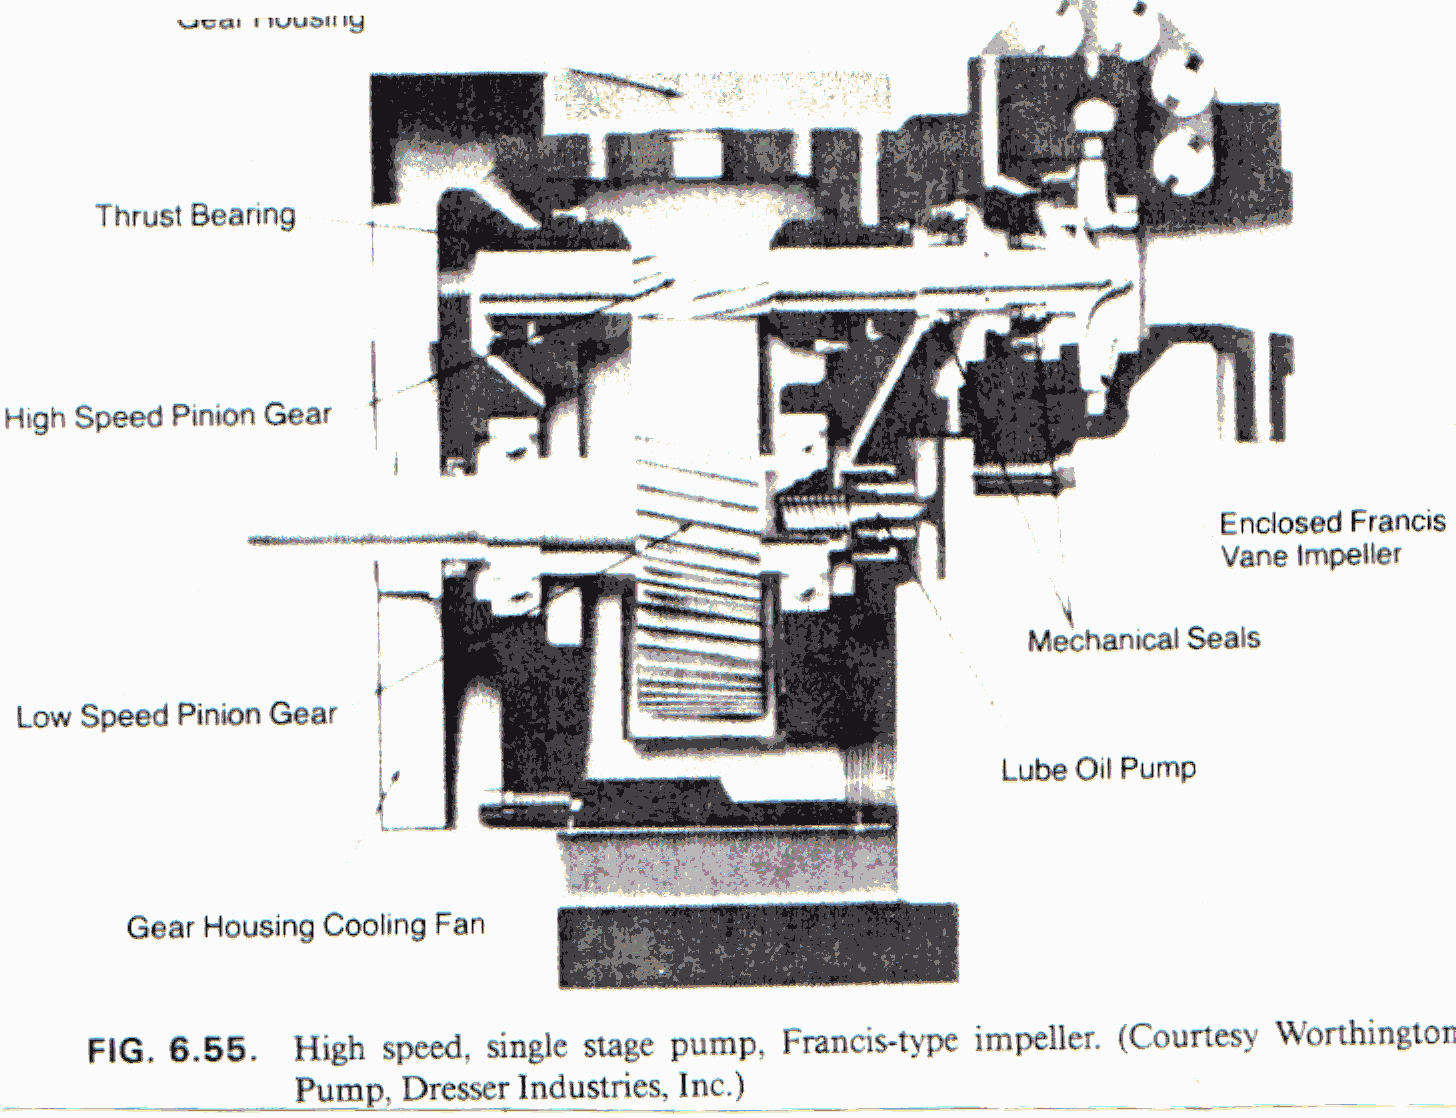
The gearbox allows the impeller to run at a different speed from the driver. Read the hydraulic stage and transmission together: bearing loads, seal conditions, lubrication, gear cooling and suction requirements are part of the selection, alongside flow and head.
Barske-type high-speed pump
Francis-type high-speed pump
Historical seal-less wet-pit and dry-pit arrangements
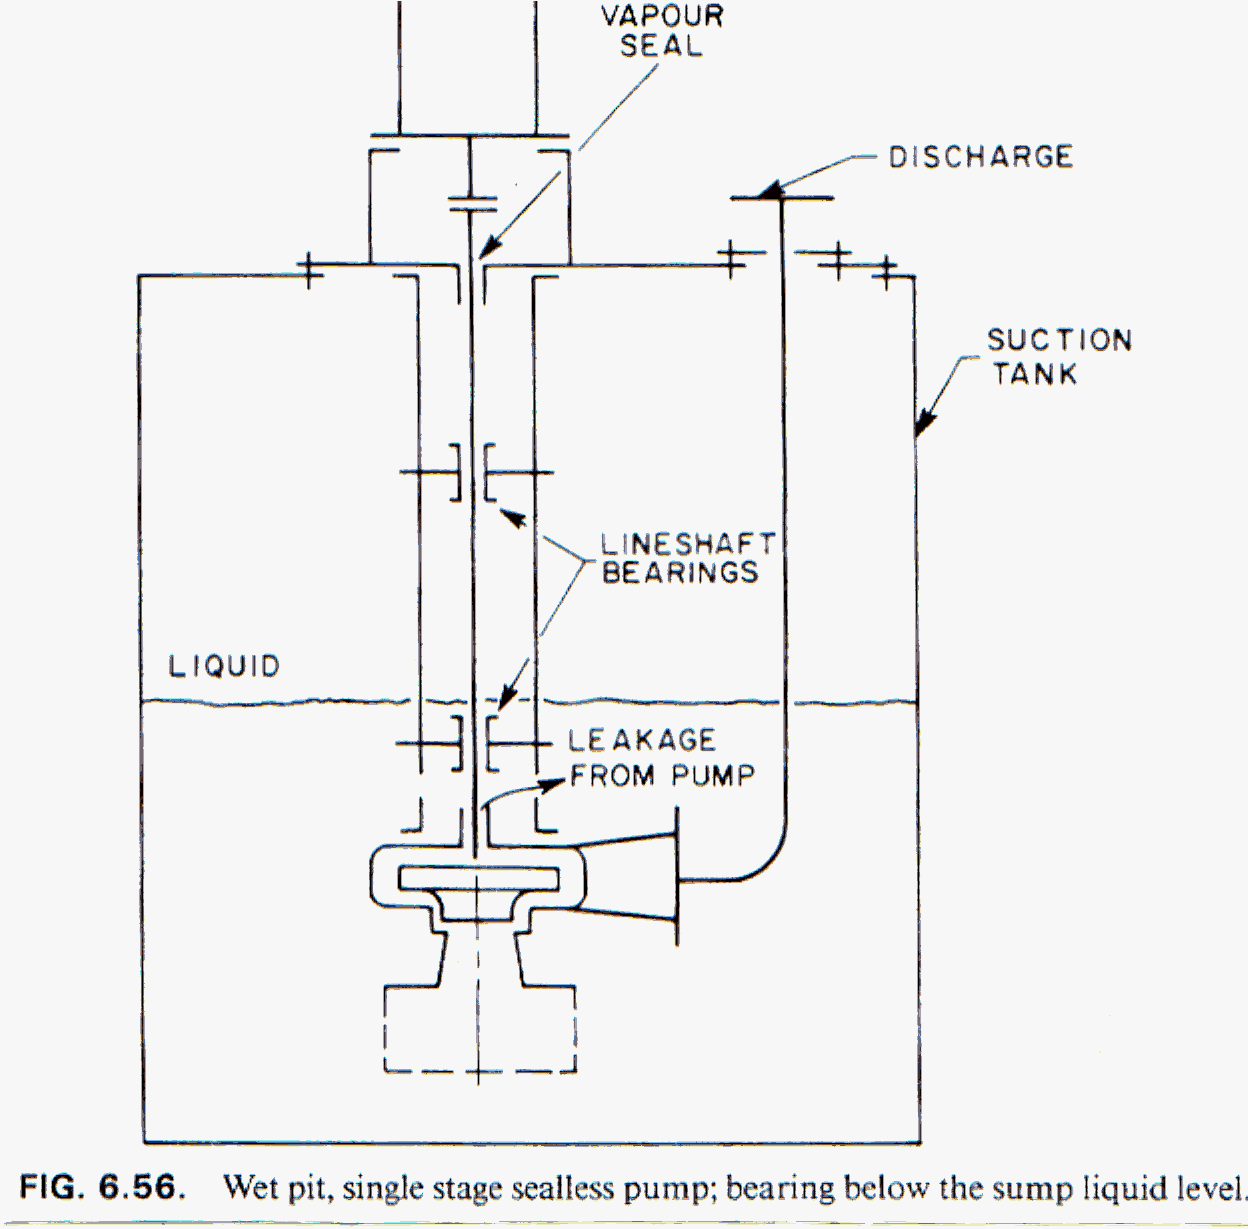
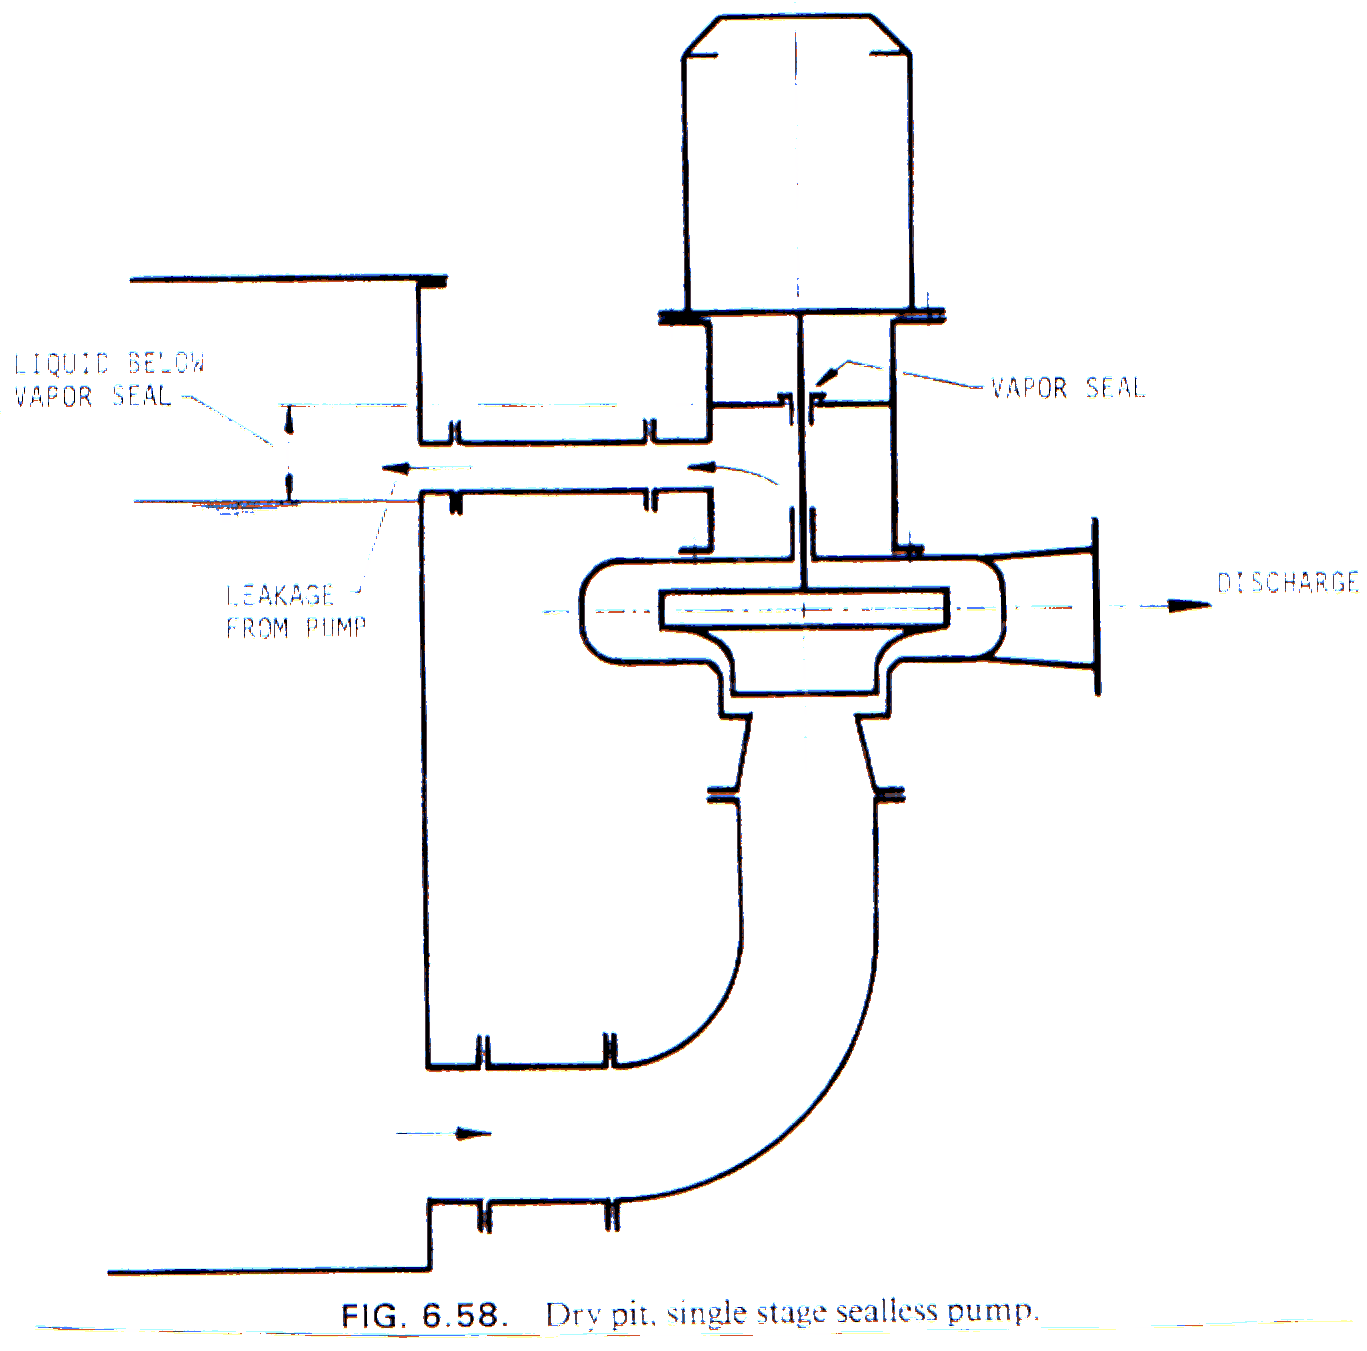
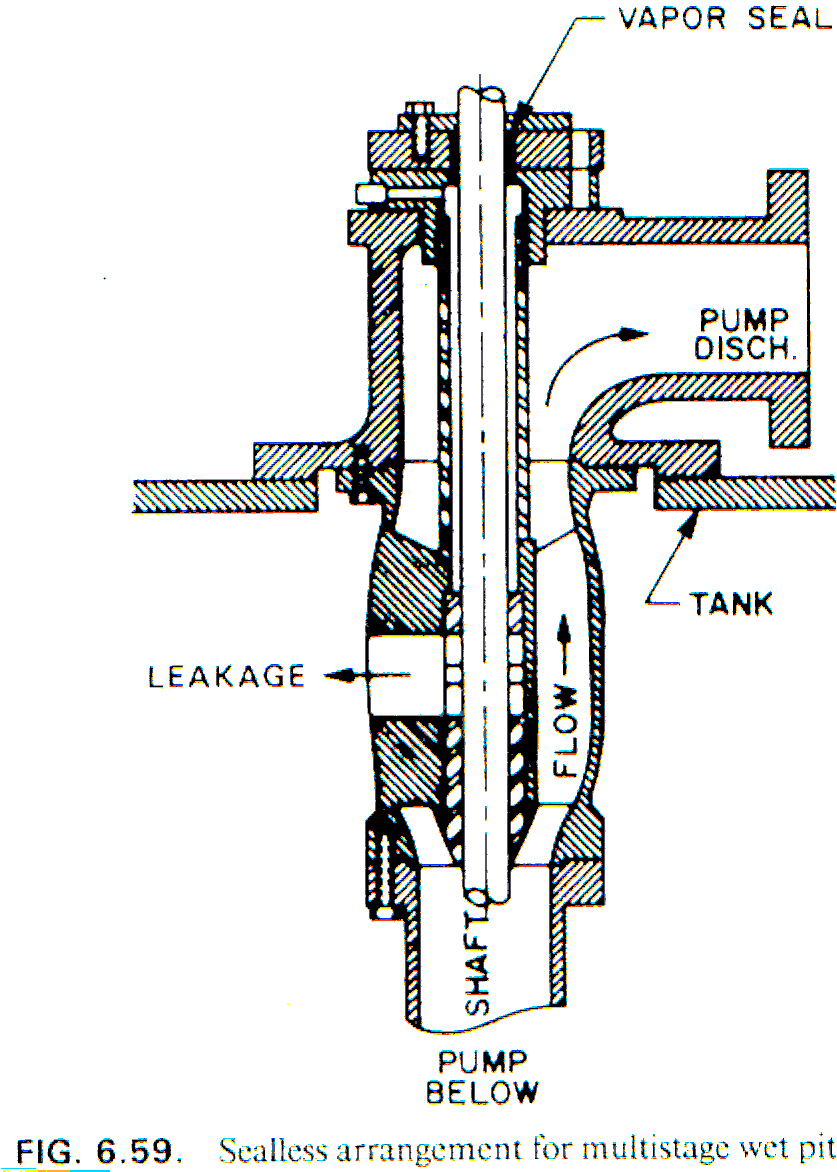
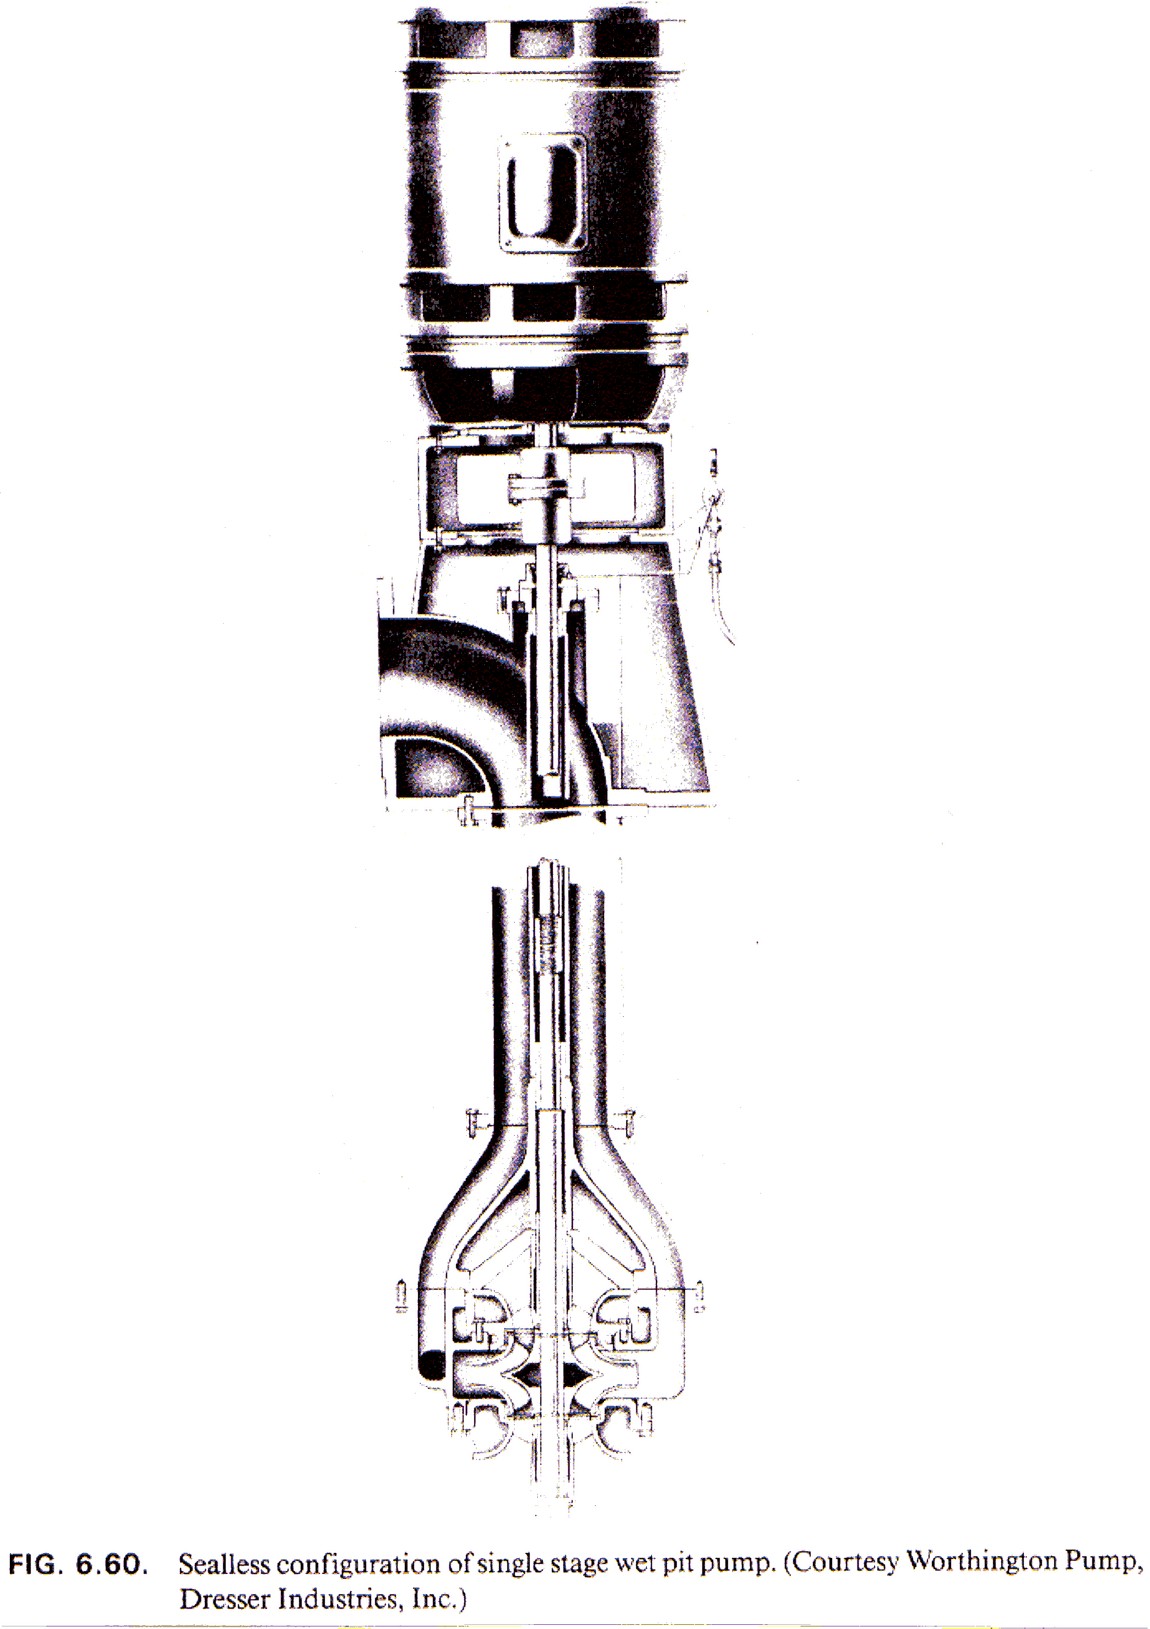
In these source diagrams, “seal-less” describes arrangements without a conventional liquid shaft seal at the illustrated pump location. Leakage is directed back into the tank or return path, and a vapour seal is shown above the liquid. This terminology must not be confused with a hermetically contained magnetic-drive or canned-motor pump.
Wet-pit single-stage arrangement
Dry-pit single-stage arrangement
Multistage wet-pit arrangement
From shaft-seal arrangements to hermetic containment
Single-stage vertical wet-pit sump pump
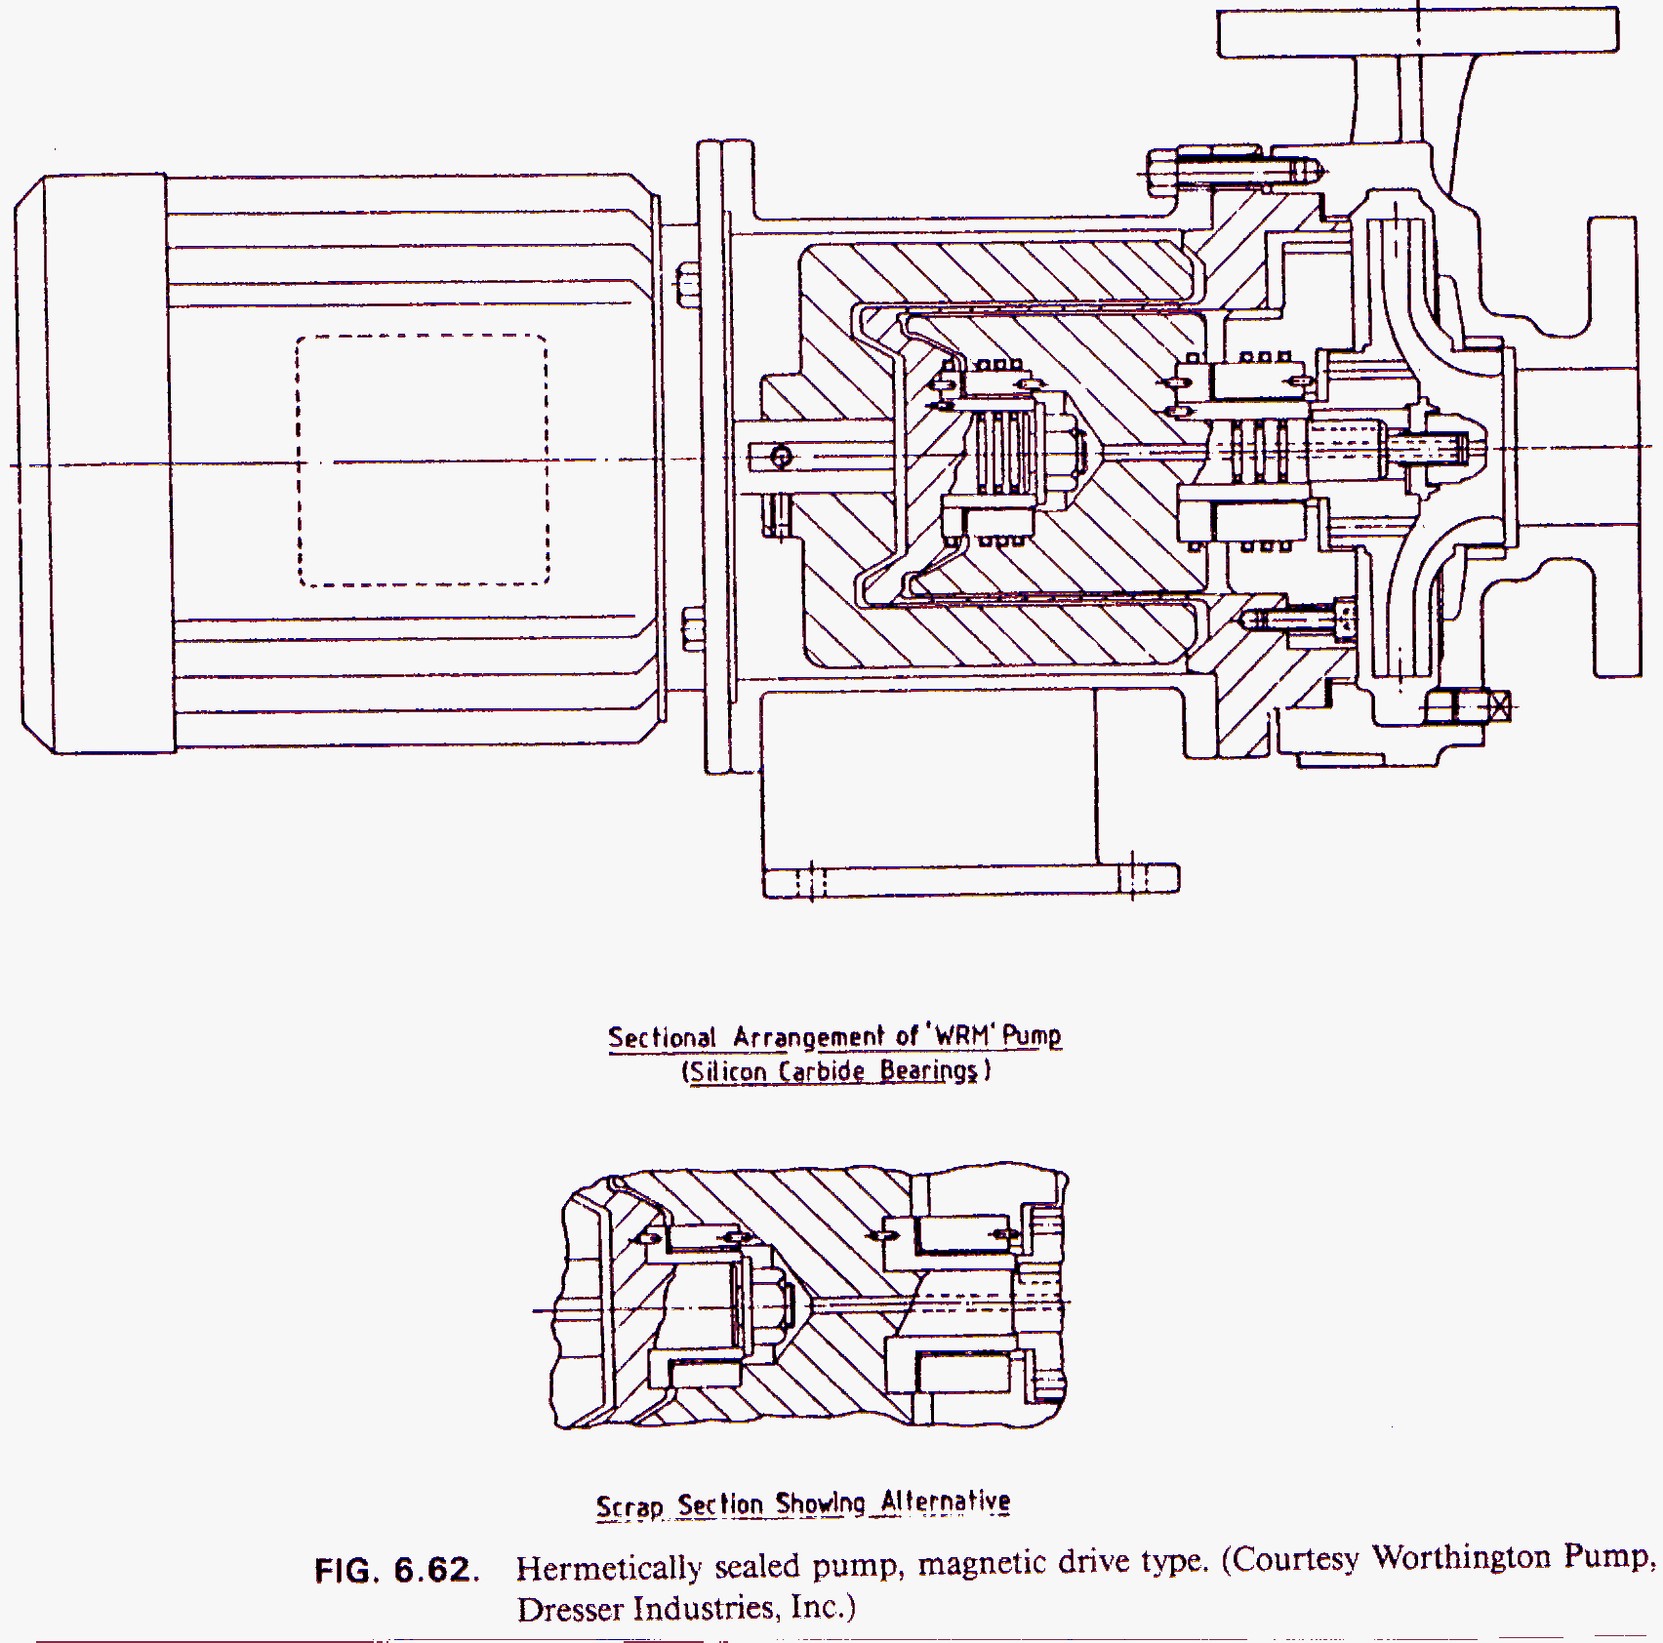
Magnetic-drive centrifugal pump
A magnetic coupling transfers torque through a stationary containment shell. The inner pump shaft is separated from the external driver; fluid compatibility, internal bearing lubrication, circulation and protection against overheating remain part of selection.
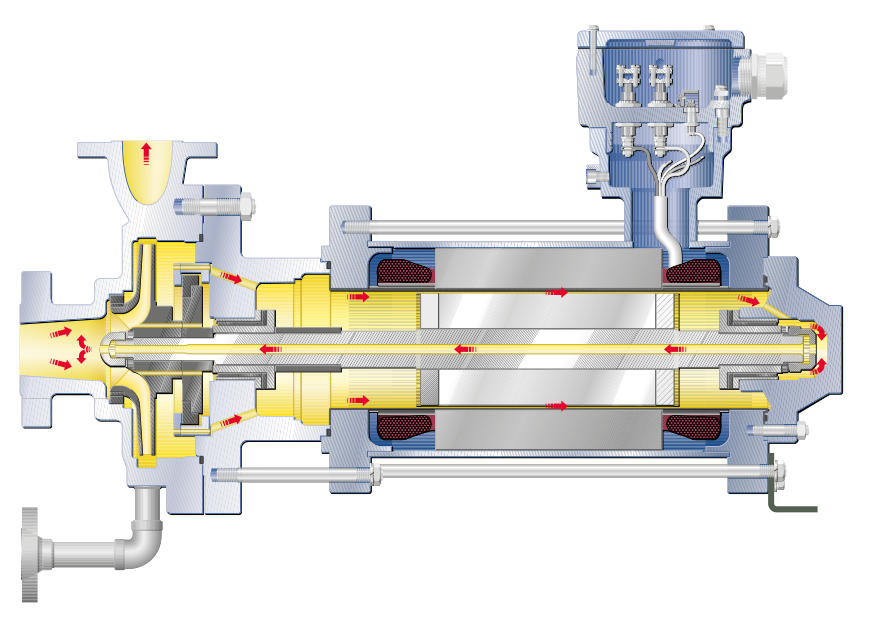
Canned-motor centrifugal pump
The pump and motor rotor form an integrated assembly, with a stationary can separating the wetted rotor from the stator. The illustrated CNP design uses a partial liquid flow to cool the motor and lubricate bearings, returning it through the hollow shaft toward the impeller suction.
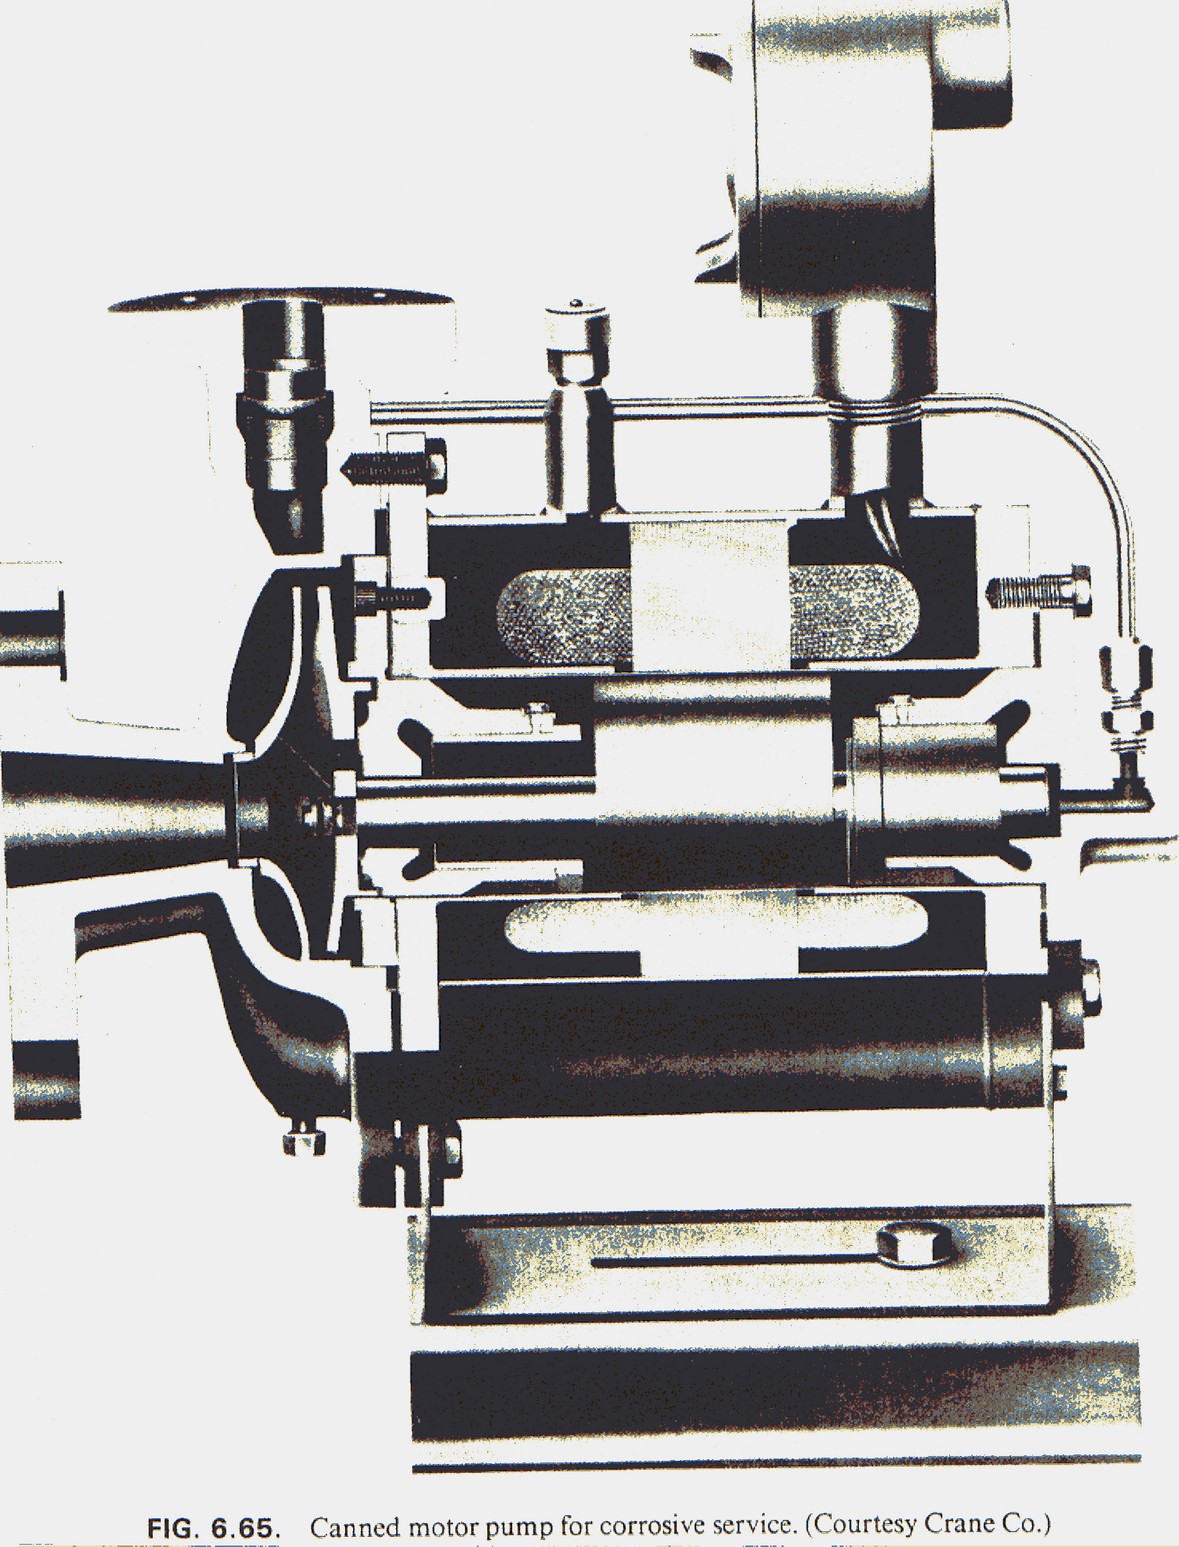
View the original canned-motor pump illustration
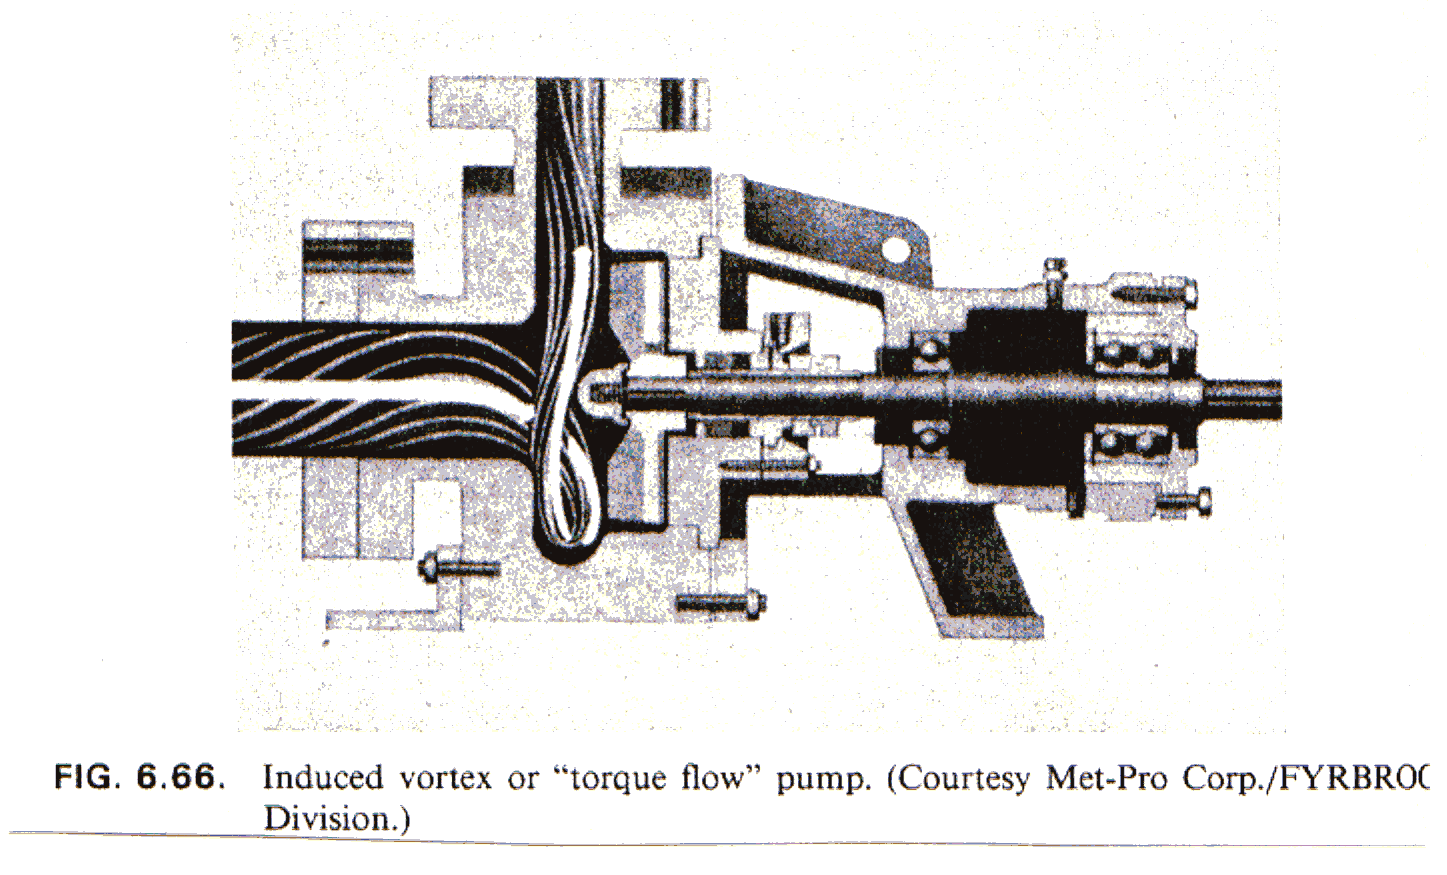
Induced-vortex or torque-flow pump
When a Rotary Positive-Displacement Pump Is the Better Candidate
The original presentation compares internal and external gears, screws, lobes and vane designs. All move liquid by changing the volume of enclosed spaces, but their clearances, allowable solids, shear characteristics and maintenance needs differ.
Gear pumps
Often considered for clean, lubricating liquids and controlled flows. Check viscosity and temperature at startup and operation, internal slip, allowable differential pressure, wear and compatibility of clearances with the fluid.
Screw pumps
May provide comparatively smooth delivery in suitable viscous-liquid services. Verify the specific screw design, suction capability, allowable contamination and the manufacturer's operating envelope.
Lobe pumps
Can be considered where fluid handling, cleanability or reduced product damage is important. Suitability for solids, abrasives or sanitation depends on the actual construction, speed and material selection.
Vane pumps
Check liquid lubrication, particle size, vane and liner wear, vapor pressure and the limits of the selected arrangement. Do not infer broad solids tolerance from the rotary principle alone.
Specify minimum/normal/maximum viscosity at operating temperature; allowable particles and gas; required differential pressure across all cases; suction pressure and start-up conditions; and independent overpressure protection. Positive-displacement pumps require protection against a blocked discharge. Never assume a catalog's maximum flow and maximum pressure occur simultaneously.
Engineering basis: Petropedam training material. For petroleum, chemical and gas services, consult the contractual API standards and publication status for the specific pump technology.
Rotary pump selection: liquid first, mechanism second
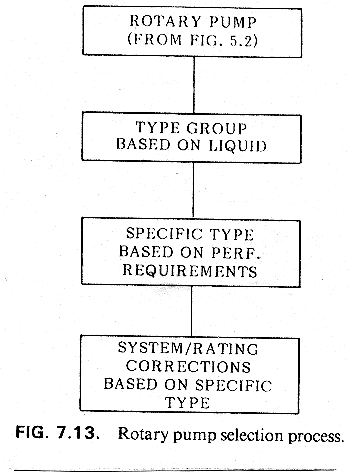
Three liquid-based mechanism groups
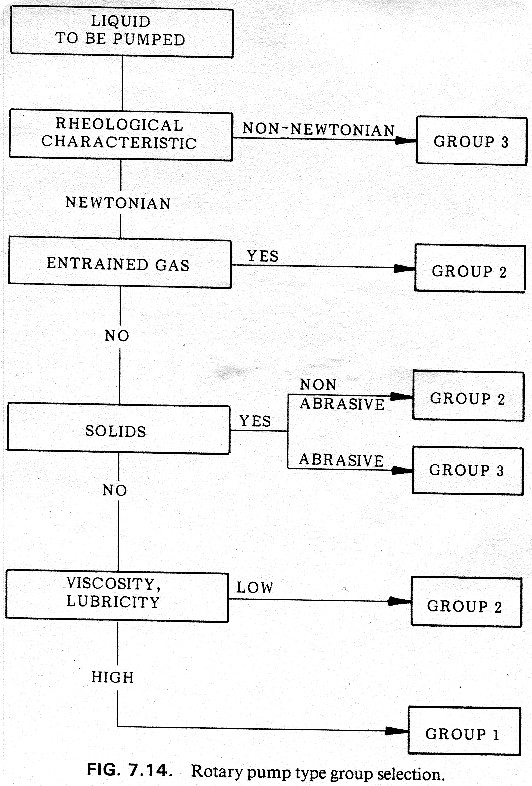
| Group | Mechanism support / force transmission | Liquid characteristics |
|---|---|---|
| 1 | Internal mechanism support and force transmission | Medium viscosity; Newtonian; good lubricity; free of solids and entrained gas |
| 2 | External mechanism support and force transmission | Medium viscosity; Newtonian; poor lubricity; nonabrasive solids; entrained gas in some designs |
| 3 | Elastomer element in the mechanism | Medium to high viscosity; non-Newtonian; abrasive solids |
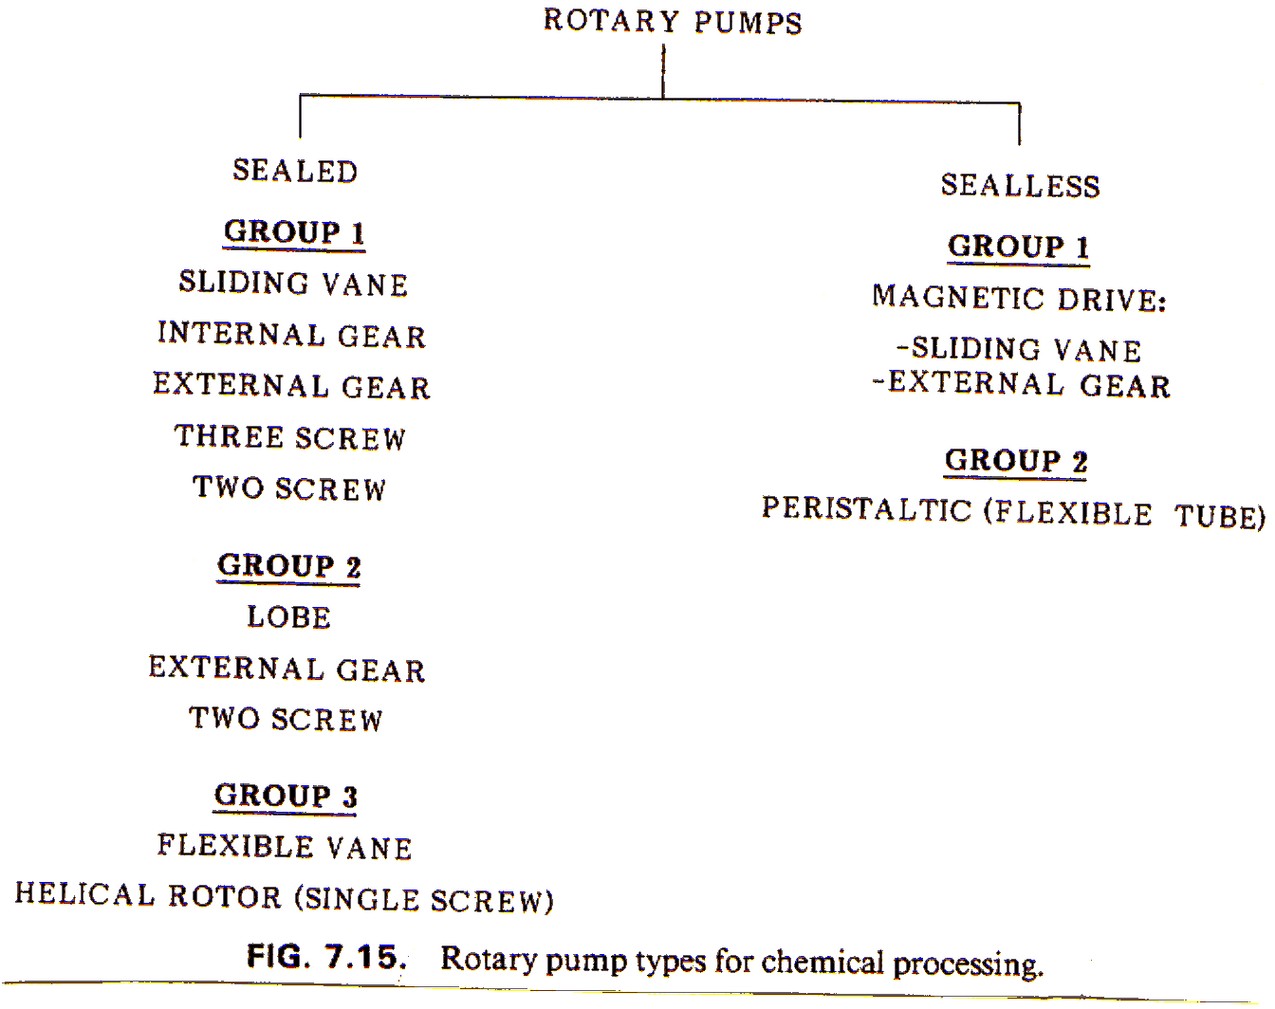
These group numbers belong to the source classification. Their broad liquid descriptions are a screening route; they do not establish solids tolerance or allowable gas for every pump in a group. View original group table.
Select a group from the liquid properties
Map the group to the source pump types
Typical flow pulsation values in the training source
The source expresses pulsation as a percentage of mean flow. These historical typical values compare delivery patterns; a listed zero is idealized and does not guarantee zero installed-system pulsation. Actual waveform and pulsation depend on geometry, speed, fluid, pressure, piping and dampener design.
| Pump type / arrangement | Flow pulsation, % of mean |
|---|---|
| Any with inlet dampener | 0 |
| Screw: two and three screw | 0 |
| Gear: helical | 0 |
| Vane | 5 |
| Lobe: two lobe | 25 |
| Lobe: three lobe | 15 |
| Helical rotor | 3 |
| Peristaltic: two roller, planar cam | 100 |
| Peristaltic: three roller | 50 |
View original pulsation table. Compare the required delivery smoothness with the process and system response; retain the independent overpressure protection already described above.
Rotary performance capabilities and construction details
The following original sections show how each rotary mechanism transports liquid and how bearing, shaft-seal and timing arrangements differ. Read them alongside the liquid-based selection workflow above.
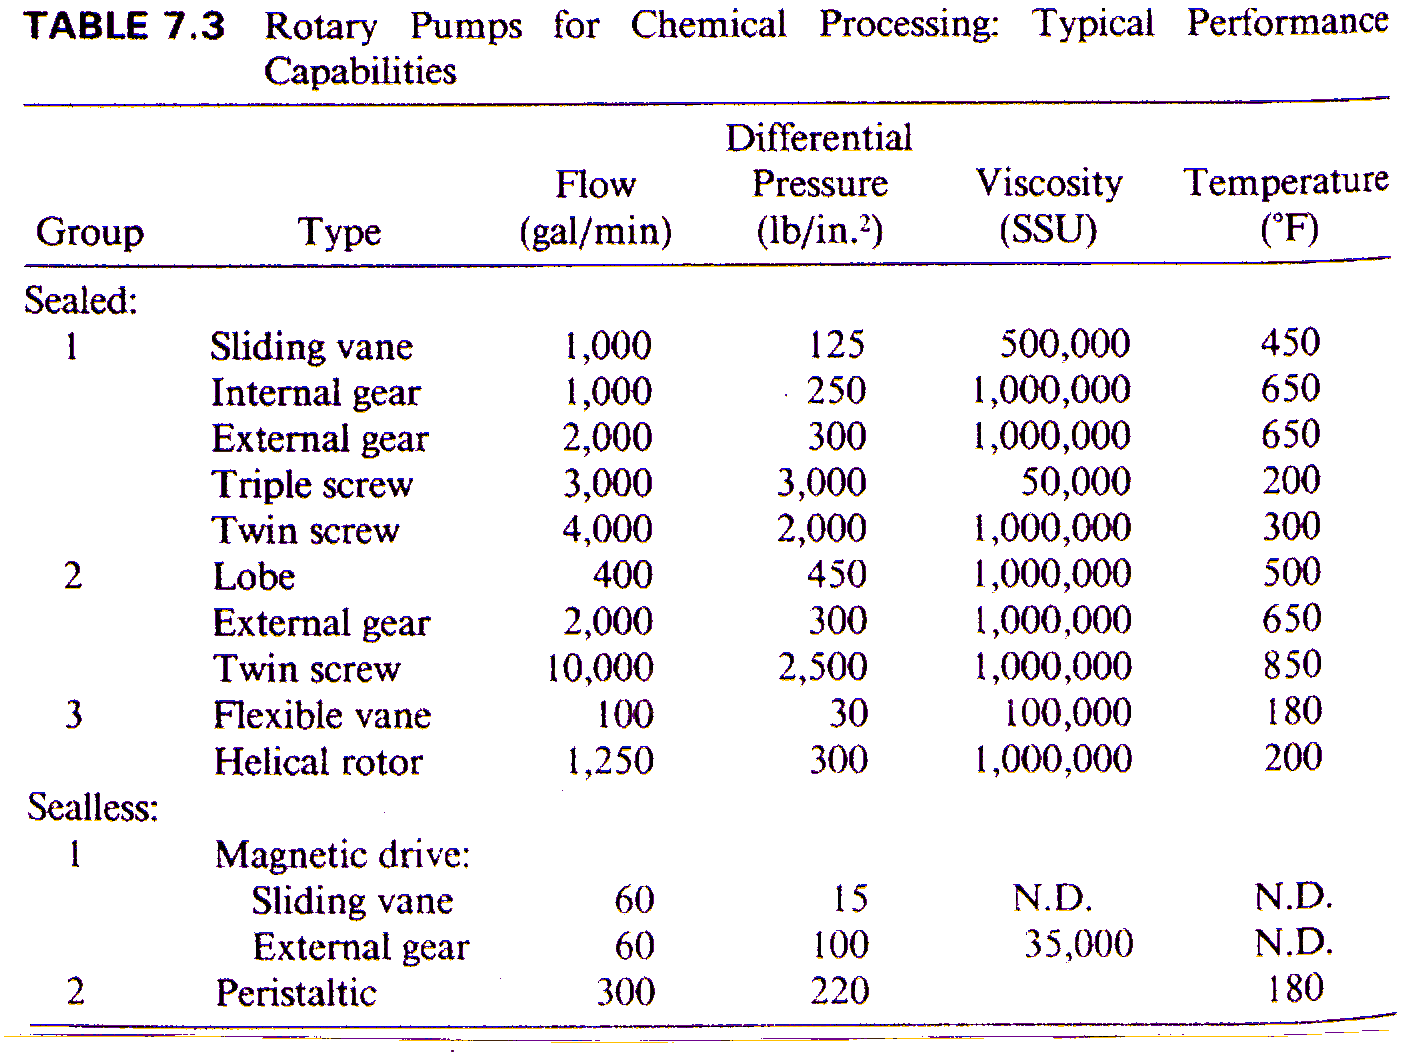
Typical performance capabilities by rotary type
| Containment | Source group | Type | Flow (gal/min) | Differential pressure (lb/in²) | Viscosity (SSU) | Temperature (°F) |
|---|---|---|---|---|---|---|
| Sealed | 1 | Sliding vane | 1,000 | 125 | 500,000 | 450 |
| Sealed | 1 | Internal gear | 1,000 | 250 | 1,000,000 | 650 |
| Sealed | 1 | External gear | 2,000 | 300 | 1,000,000 | 650 |
| Sealed | 1 | Triple screw | 3,000 | 3,000 | 50,000 | 200 |
| Sealed | 1 | Twin screw | 4,000 | 2,000 | 1,000,000 | 300 |
| Sealed | 2 | Lobe | 400 | 450 | 1,000,000 | 500 |
| Sealed | 2 | External gear | 2,000 | 300 | 1,000,000 | 650 |
| Sealed | 2 | Twin screw | 10,000 | 2,500 | 1,000,000 | 850 |
| Sealed | 3 | Flexible vane | 100 | 30 | 100,000 | 180 |
| Sealed | 3 | Helical rotor | 1,250 | 300 | 1,000,000 | 200 |
| Sealless | 1 | Magnetic-drive sliding vane | 60 | 15 | N.D. | N.D. |
| Sealless | 1 | Magnetic-drive external gear | 60 | 100 | 35,000 | N.D. |
| Sealless | 2 | Peristaltic | 300 | 220 | — | 180 |
Values and units are retained from the training table. N.D. is the source notation for data not given; a dash represents a blank source cell. The source group numbers refer to the preceding historical classification. These figures are teaching comparisons, not Petropedam product ratings or simultaneous operating limits. SSU is a viscosity measure expressed in Saybolt Universal seconds; conversion to other viscosity units requires the measurement conditions.
View the original performance-capability table
Sliding-vane and gear pumping mechanisms
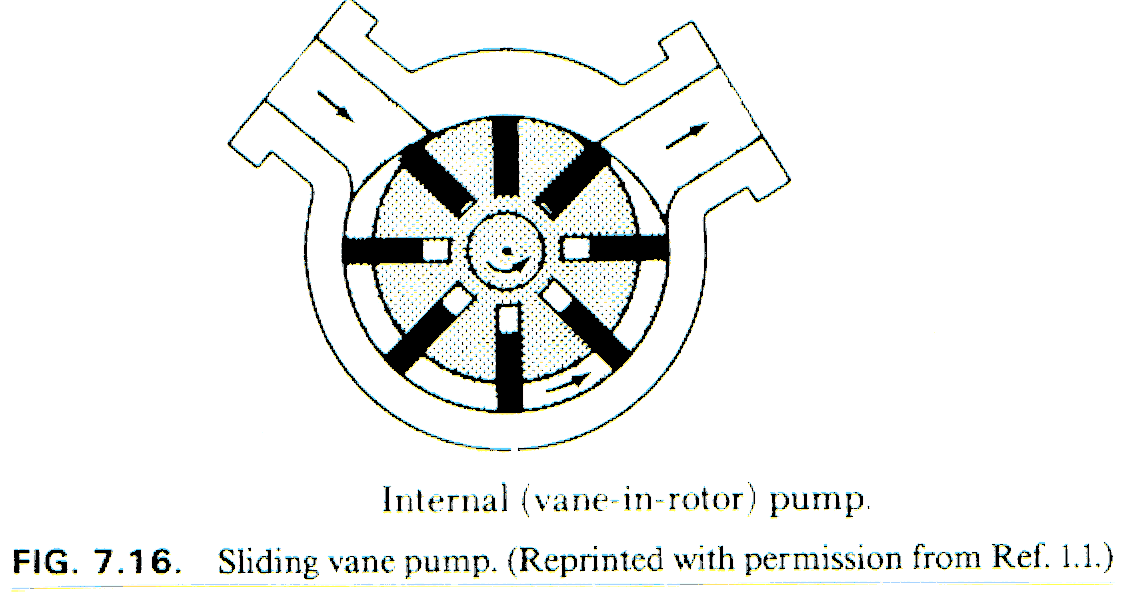
Sliding-vane pump
Vanes move radially in rotor slots as the rotor turns in an eccentric housing. The spaces between adjacent vanes expand at the inlet and contract toward the outlet.
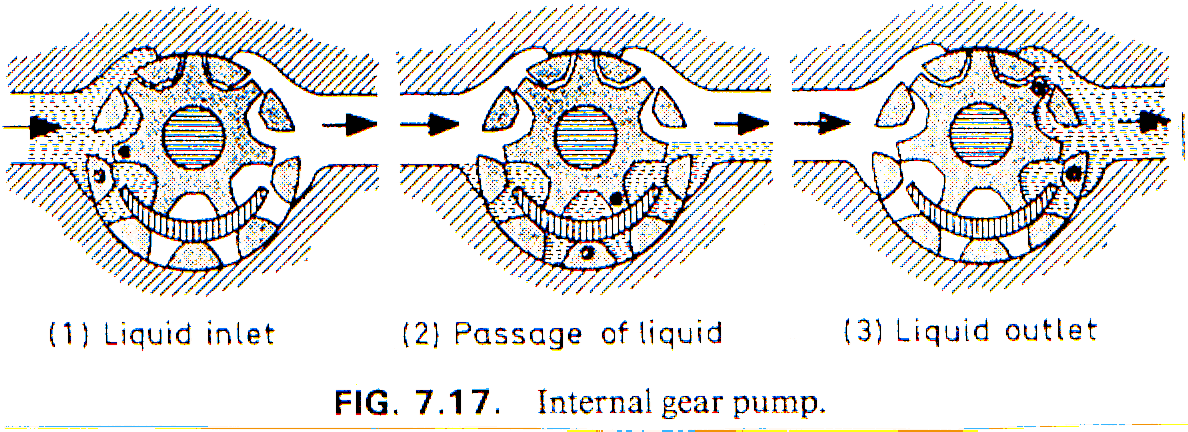
Internal gear pump
Liquid fills the spaces exposed as the gears separate at the inlet, travels around the casing, and is displaced when the teeth re-engage at the outlet. The three original views show this sequence.
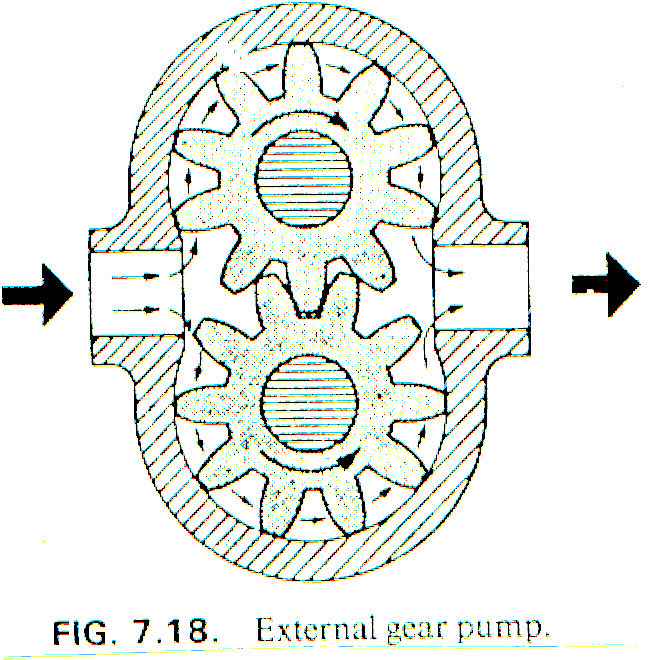
External gear pump
Two externally toothed gears transport liquid in the spaces between the teeth and casing. Liquid travels around the outside of the gears; the meshing zone separates suction from discharge.
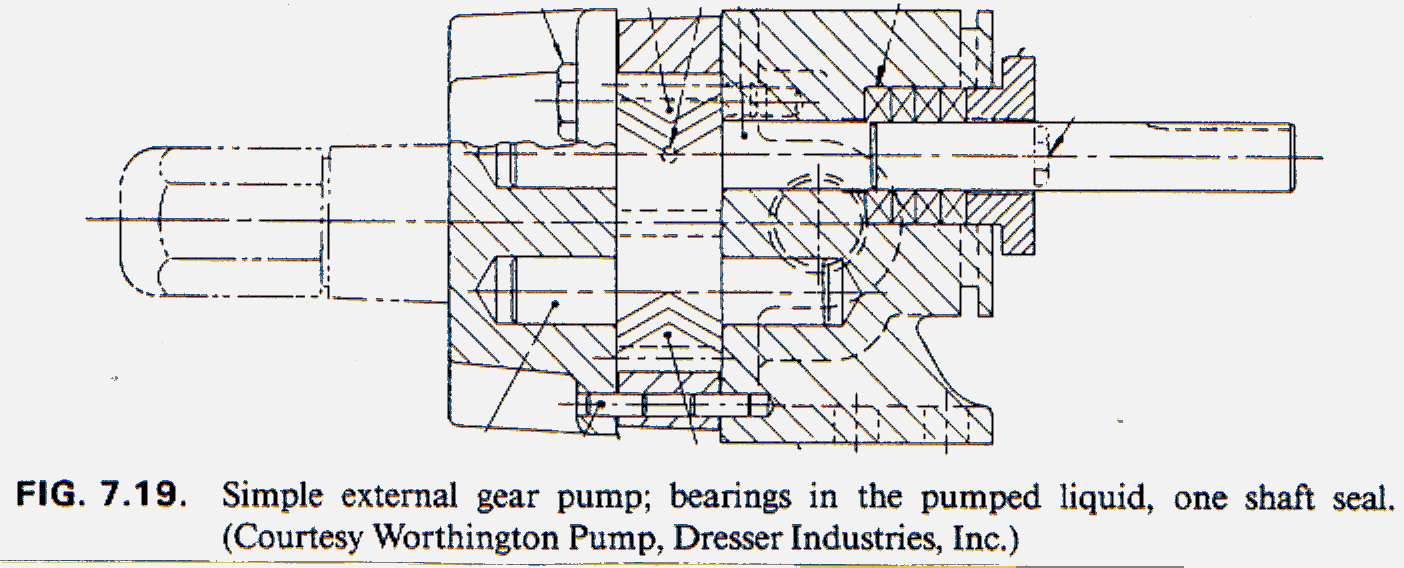
External gear pump with wetted bearings
This section adds the shaft-support and sealing arrangement to the preceding pumping principle. Bearings in the pumped liquid make liquid lubrication and contamination important selection inputs.
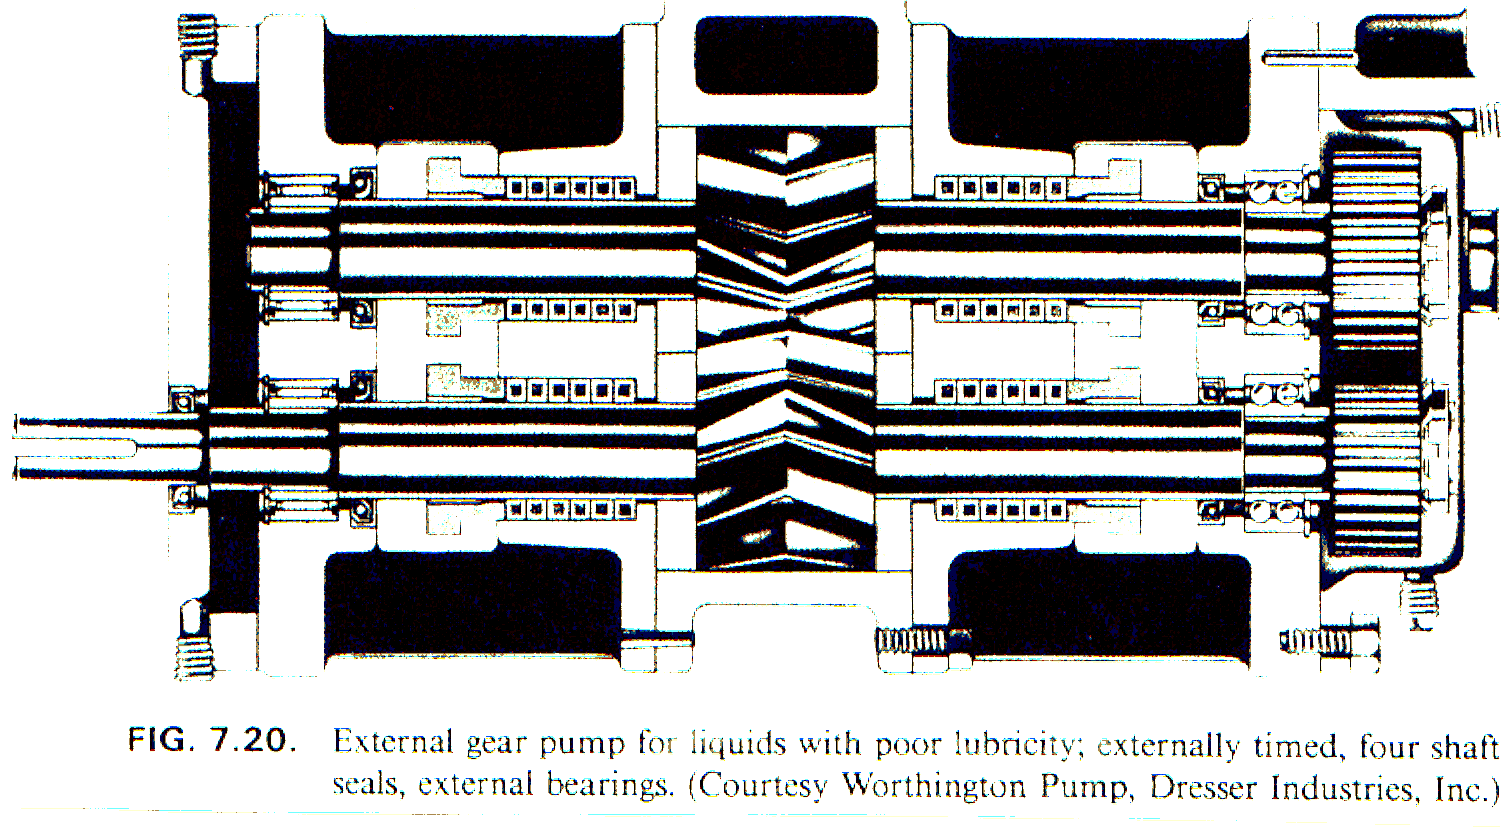
Externally timed external gear pump
External timing and bearing support provide a different arrangement for liquids with poor lubricity. Compare the external support and shaft seals with the wetted-bearing construction.
Screw pumps: flow paths, timing and rotor support
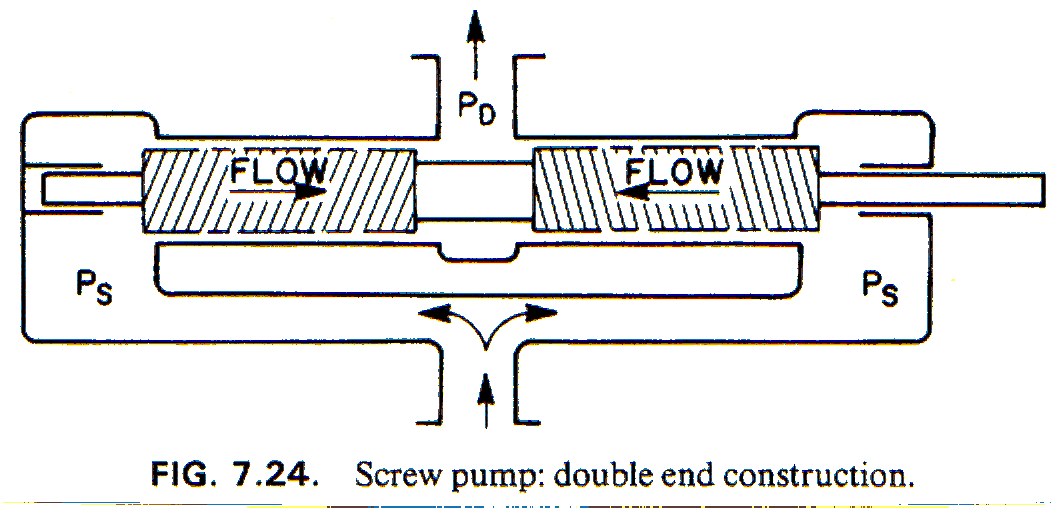
Double-end screw-pump construction
The original schematic shows suction at both ends and discharge in the middle. Follow the arrows from the two suction regions marked Pₛ toward the central discharge marked Pᴅ.
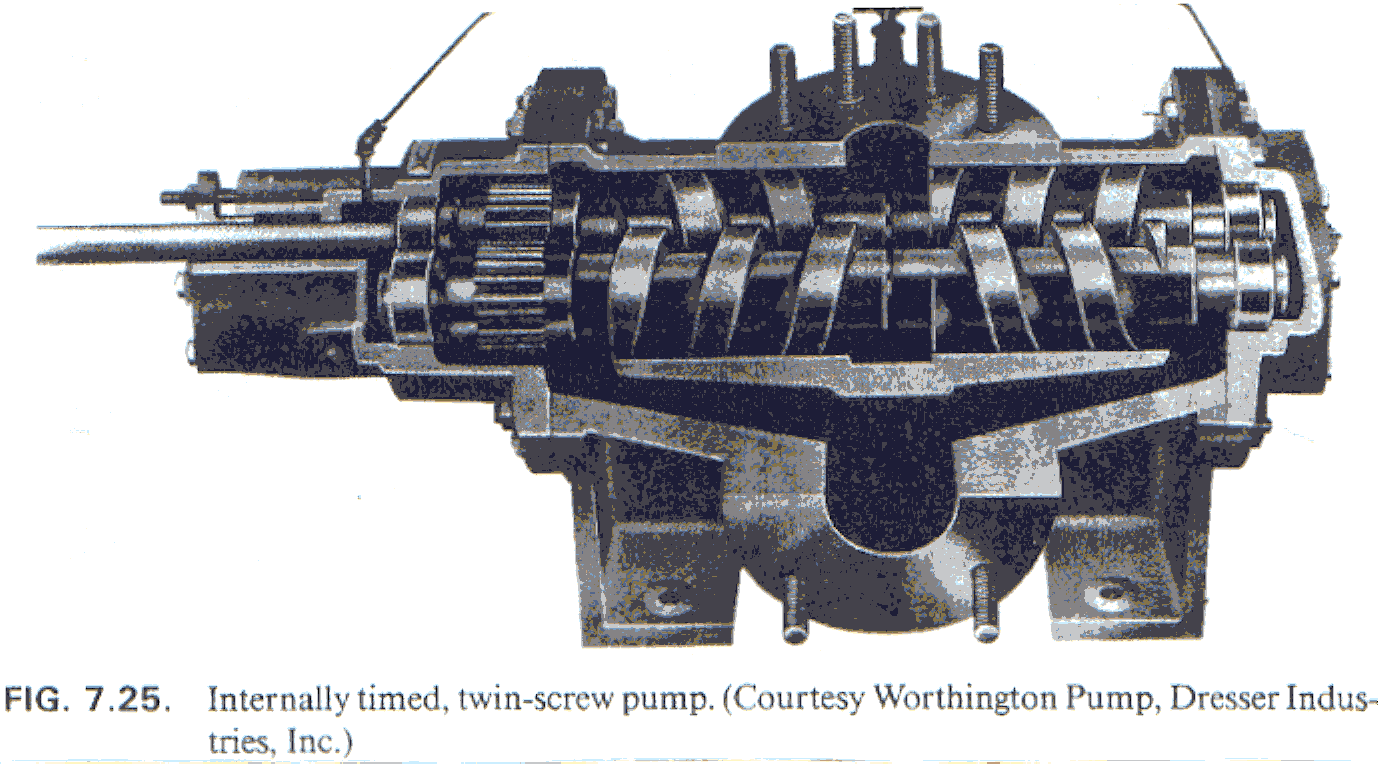
Internally timed twin-screw pump
The source section shows the internally timed arrangement. Compare the rotor relationship and internal support with the externally timed example that follows.
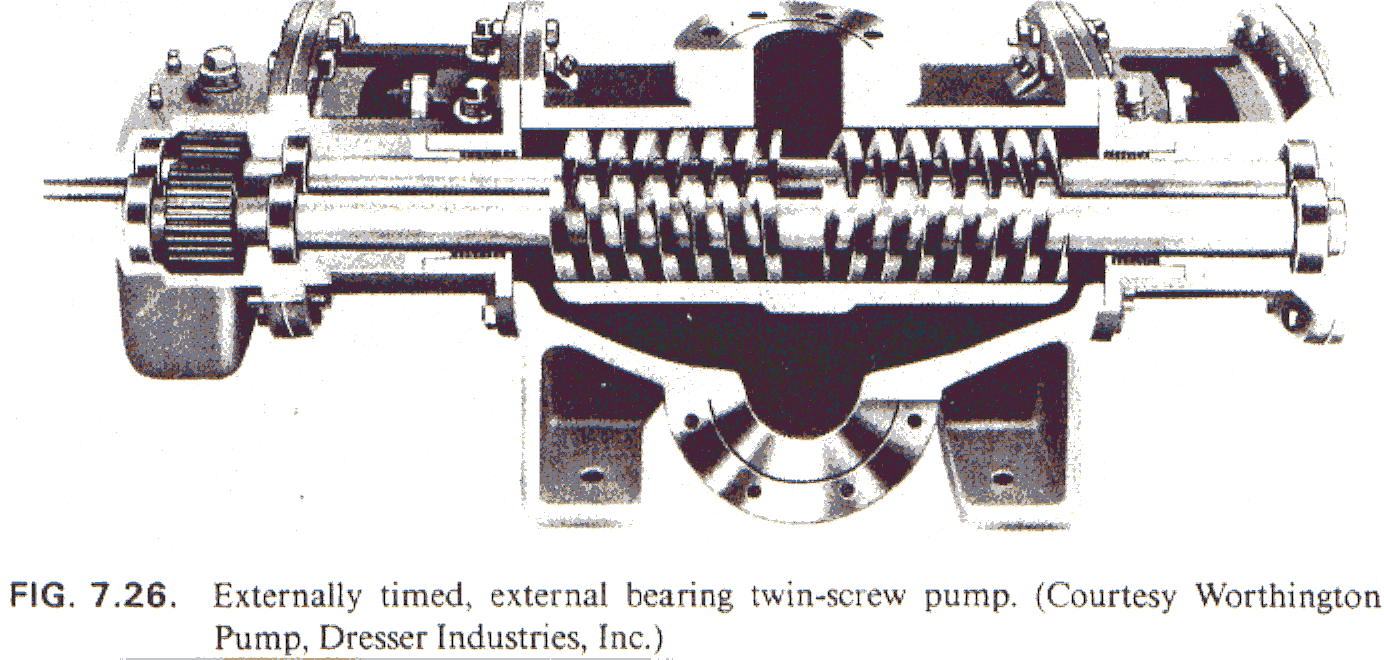
Externally timed twin-screw pump
The timing mechanism is outside the pumping chamber, with external bearings. Liquid lubricity and the location of bearings and seals distinguish this construction from the preceding example.
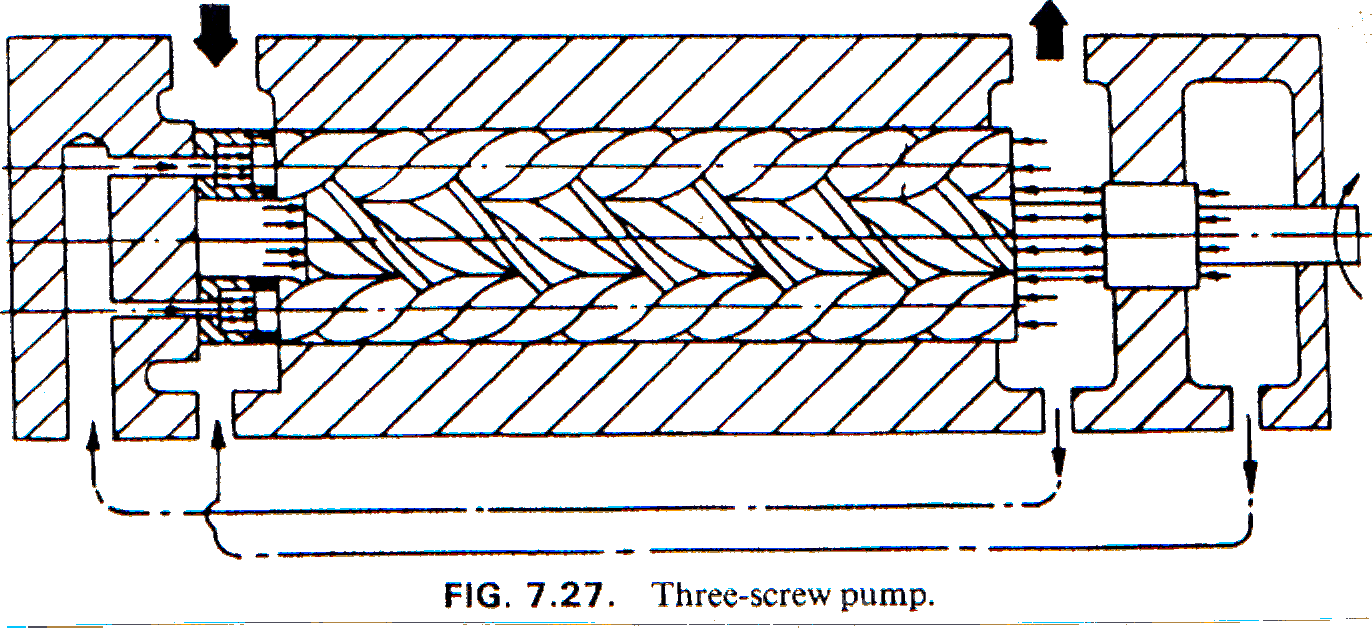
Three-screw pump
The original longitudinal section shows three intermeshing screws and the inlet and outlet arrows. Their rotation moves enclosed liquid volumes along the screw passages.
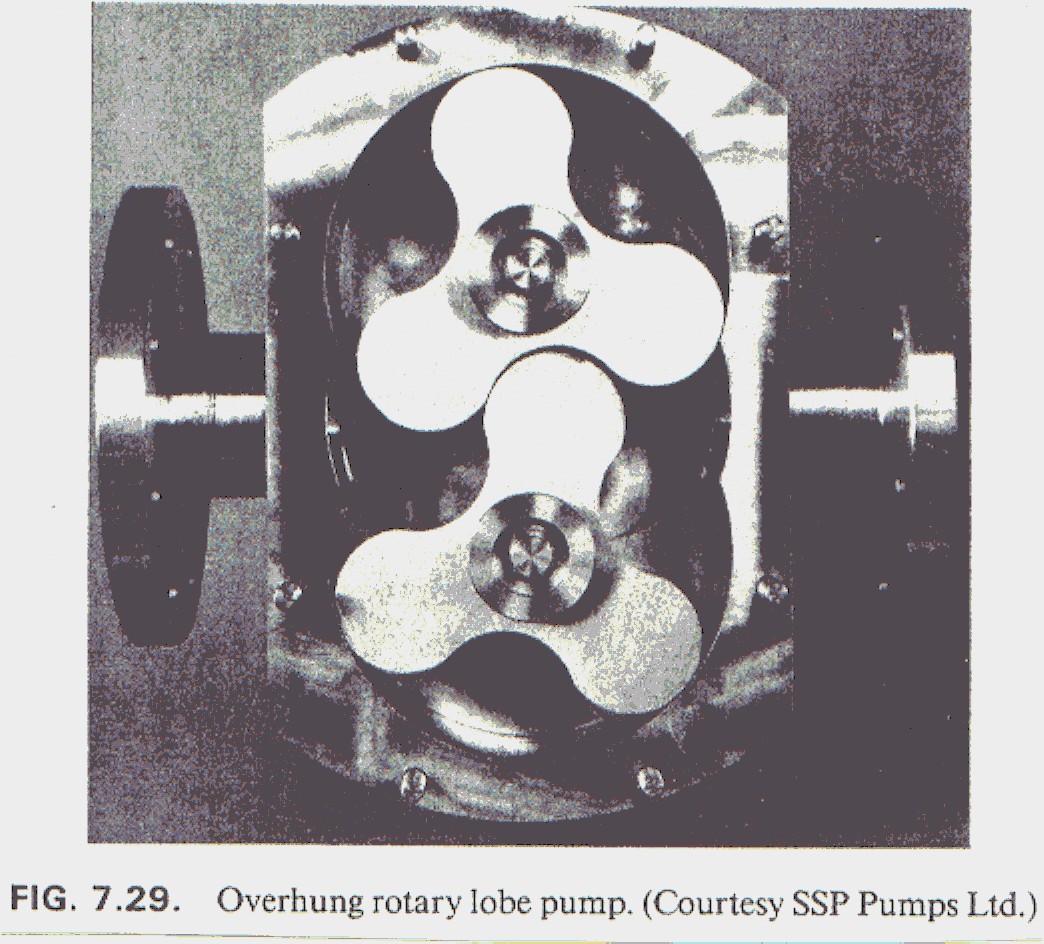
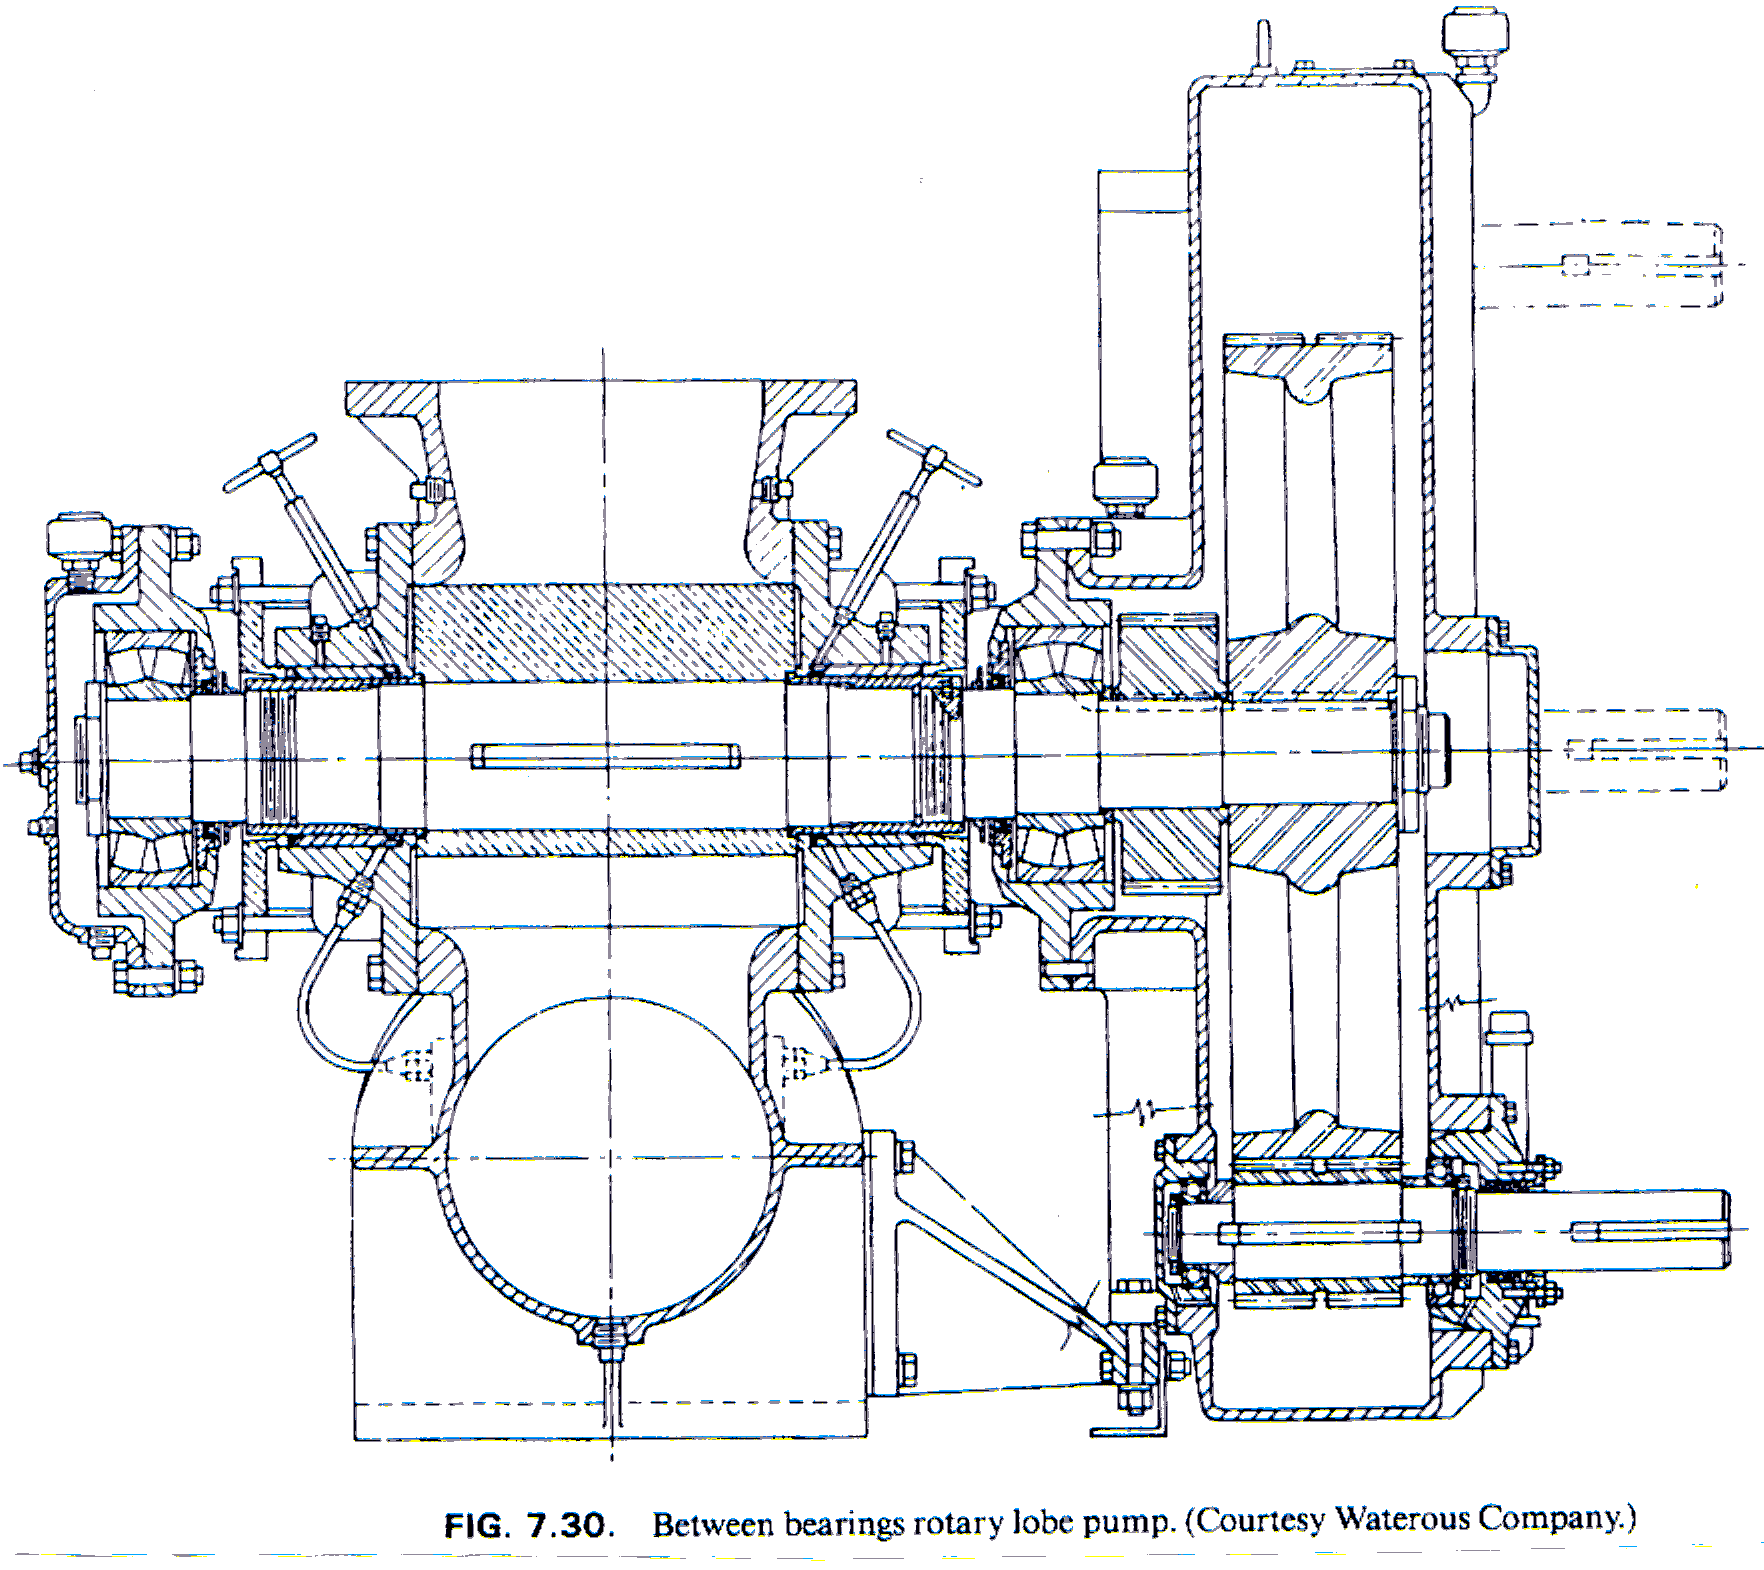
Rotary lobe pumps: rotor view and bearing arrangement
The rotor-face photograph and longitudinal section show complementary views of a lobe pump. Liquid travels around the outside of the lobes; external timing gears maintain their relative position. The bearing and sealing arrangement must be considered with the required differential pressure and liquid properties.
Further reading: Hydraulic Institute pump-type definitions; Pump School rotary selection guidance. The original construction illustrations and numerical table remain the engineering training source.
Flexible vane, helical rotor and peristaltic constructions
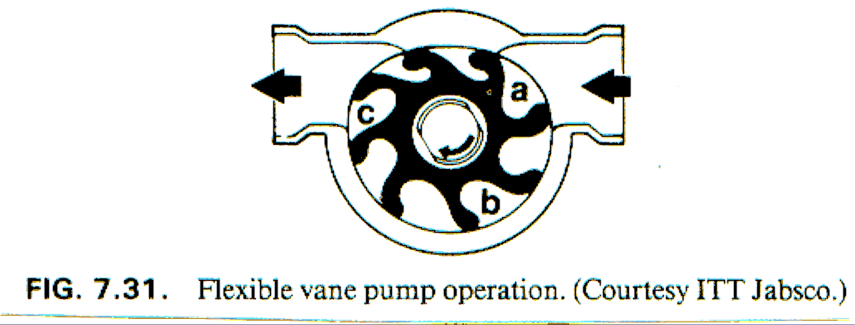
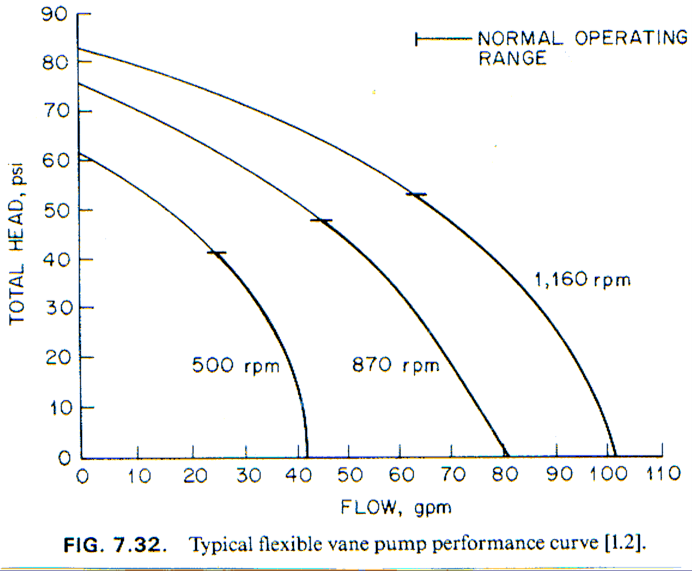
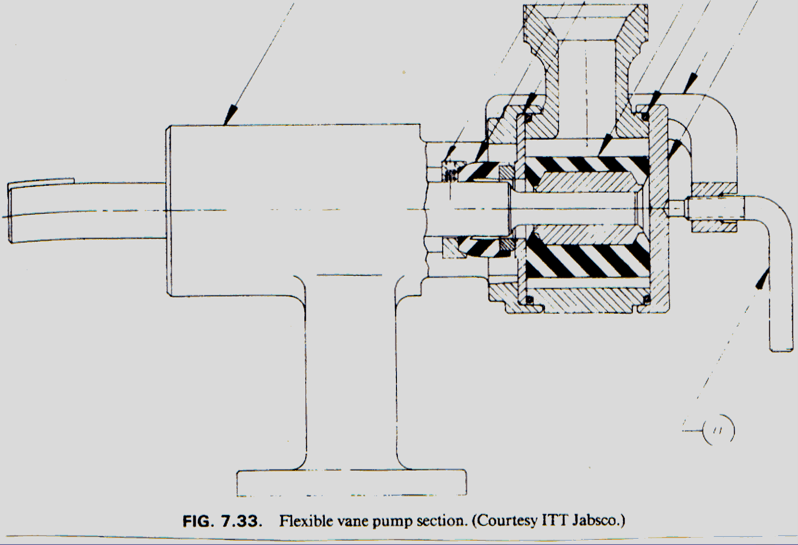
Flexible vane: operation, performance and section
The original sequence shows the vane deformation, the flow–pressure curves at three rotational speeds, and the pump cross-section.
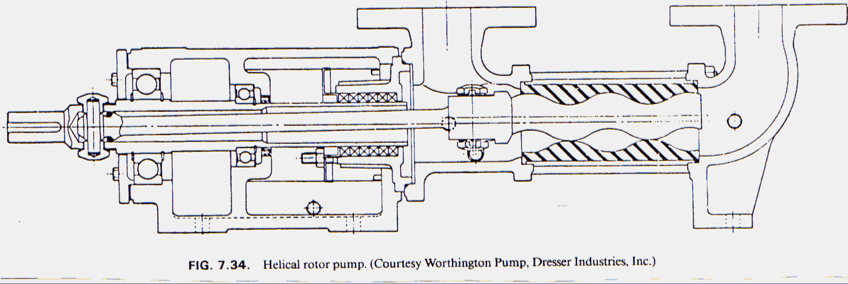
Helical rotor / progressing cavity: construction and materials
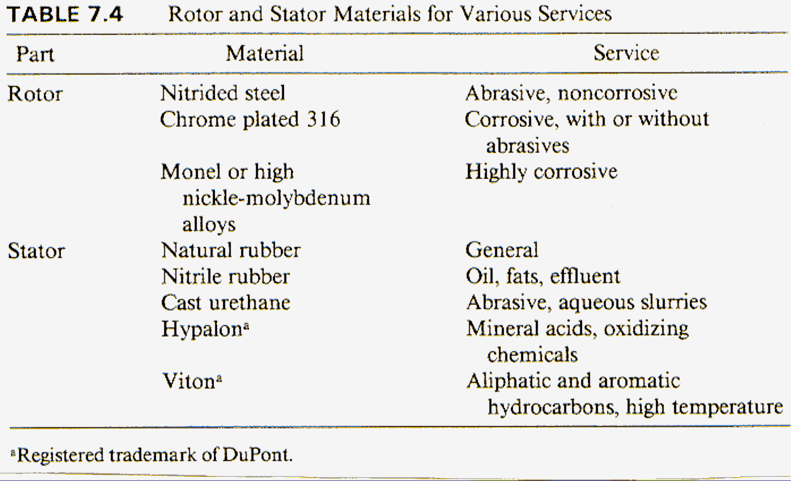
The closed-throat and open-throat sections show the rotor/stator assembly, drive connection and inlet arrangements. The material table is reproduced below in readable form, followed by the supplied original.
| Part | Material | Service |
|---|---|---|
| Rotor | Nitrided steel | Abrasive, noncorrosive |
| Rotor | Chrome plated 316 | Corrosive, with or without abrasives |
| Rotor | Monel or high nickel-molybdenum alloys | Highly corrosive |
| Stator | Natural rubber | General |
| Stator | Nitrile rubber | Oil, fats, effluent |
| Stator | Cast urethane | Abrasive, aqueous slurries |
| Stator | Hypalona | Mineral acids, oxidizing chemicals |
| Stator | Vitona | Aliphatic and aromatic hydrocarbons, high temperature |
a Registered trademark of DuPont, as noted in the original table. These service descriptions are retained from the training source; verify compatibility for the actual liquid composition and temperature.
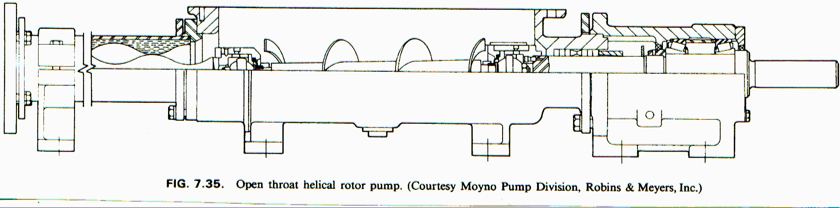
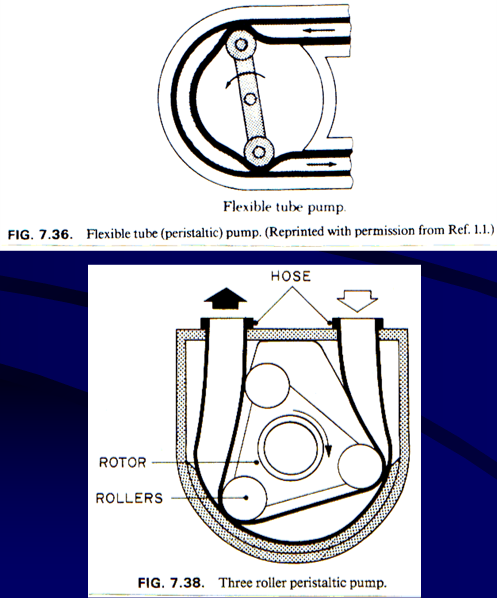
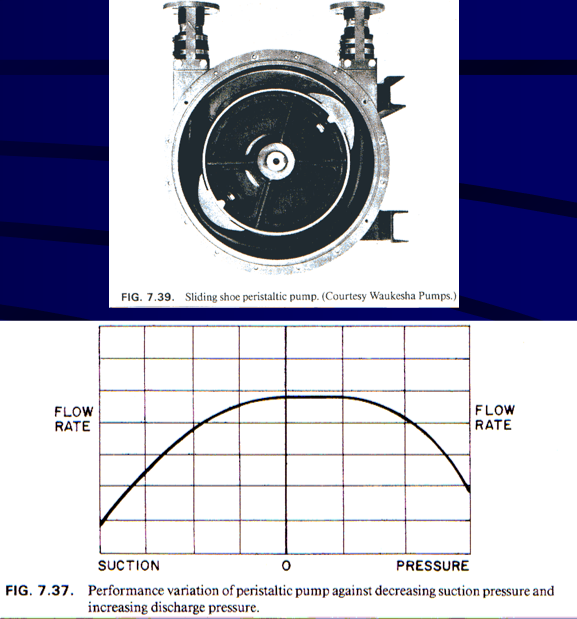
Peristaltic pumps: hose compression and delivery
The original illustrations compare flexible-tube, three-roller and sliding-shoe arrangements. The performance drawing shows the qualitative change of delivery as suction pressure decreases and discharge pressure increases.
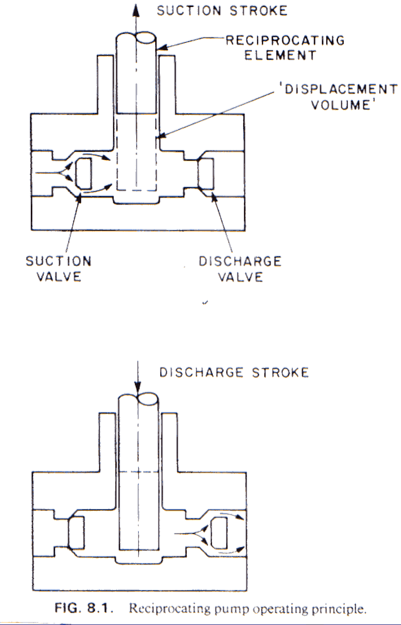
Inside a Reciprocating Pump: From Stroke to System Behavior
The original teaching figures show a piston or plunger moving through suction and discharge strokes. Check valves control direction. The cyclic motion creates flow pulsation, which makes suction and discharge system design central to reliable operation.
Protect inlet conditions
Check minimum inlet pressure, acceleration effects, suction-line losses, available inlet energy and fluid vapor pressure through the entire operating range. For viscous liquid or entrained gas, obtain project-specific vendor guidance.
Evaluate piping response
Check cyclic pressure, pulsation-control equipment, valve behavior, piping forces and vibration. A simplified average flow does not capture instantaneous line conditions.
Prevent overpressure
Provide discharge pressure protection appropriate to the system. Check seals/packing, valve maintenance, driver torque, corrosion and abrasive wear against each duty case.
A reciprocating pump can be attractive for high differential pressure at a suitable flow, but the final decision must include suction conditions, liquid cleanliness, speed, pulsation limits, maintainability and total system cost. Pressure alone is not sufficient.
Engineering basis: Petropedam training material; API Standard 674 publication plan. The edition required by the purchase specification governs.
Reciprocating selection and classification
Selection from seals, solids and pressure
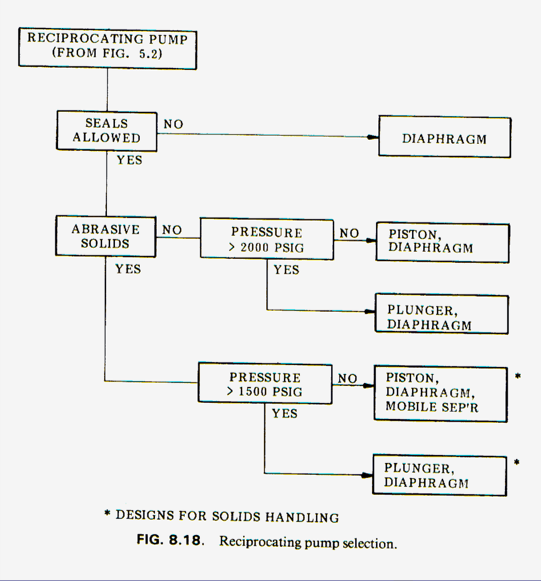
The original decision tree starts with whether seals are allowed, then checks abrasive solids and pressure. It uses 2,000 psig for the nonabrasive branch and 1,500 psig for the abrasive-solids branch. The starred options indicate designs for solids handling.
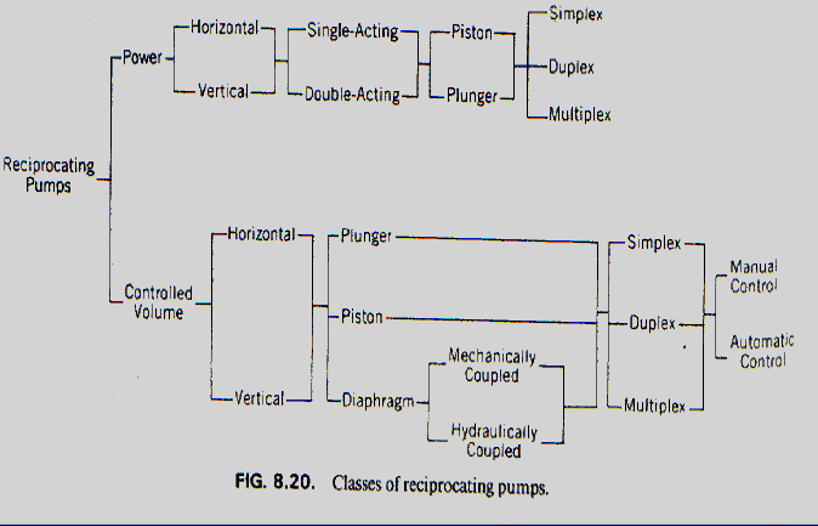
Power and controlled-volume pump classes
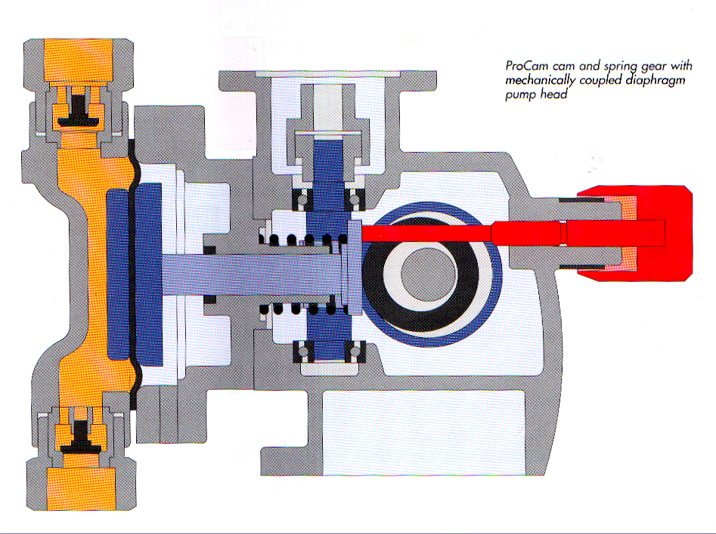
The power-pump branch identifies horizontal or vertical orientation, single- or double-acting operation, piston or plunger elements, and simplex, duplex or multiplex arrangements. The controlled-volume branch includes plunger, piston and diaphragm designs, mechanical or hydraulic diaphragm coupling, and manual or automatic control.
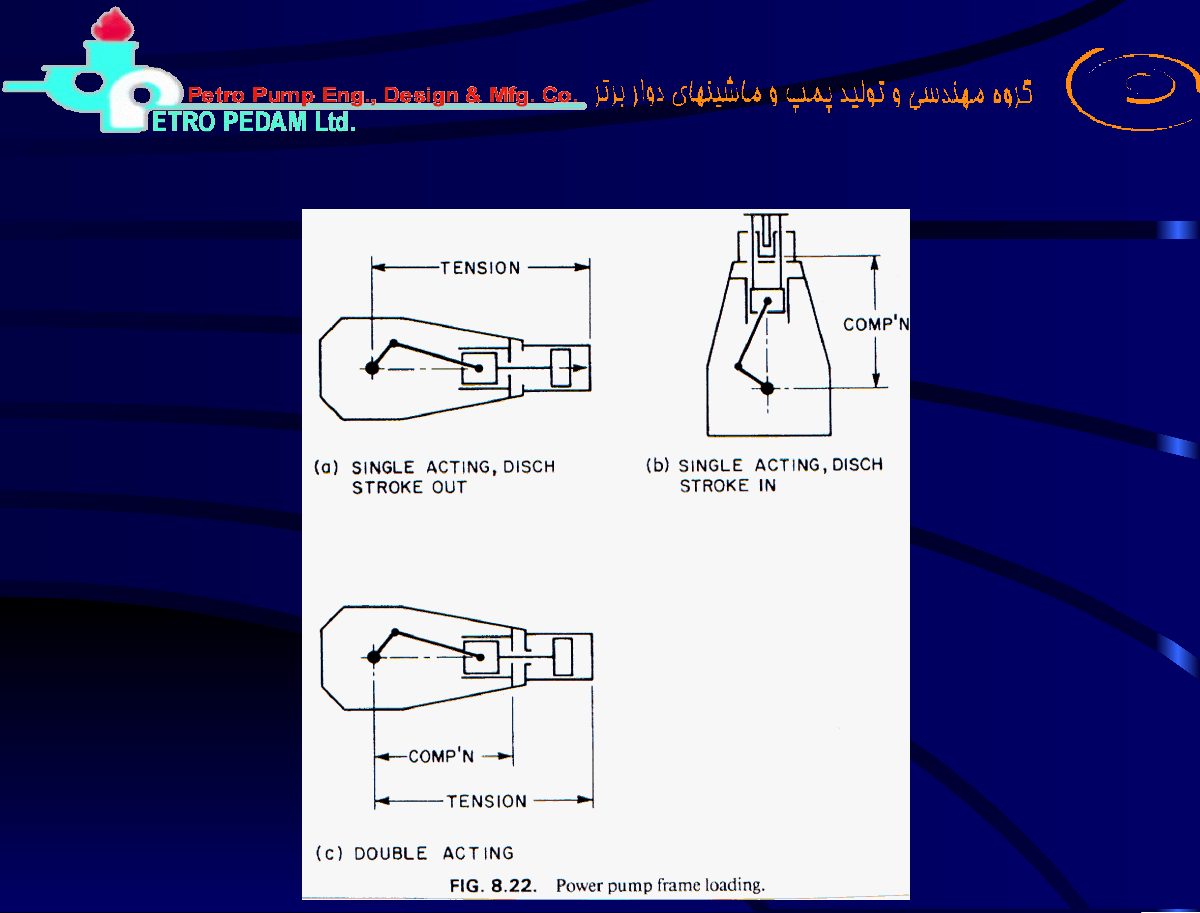
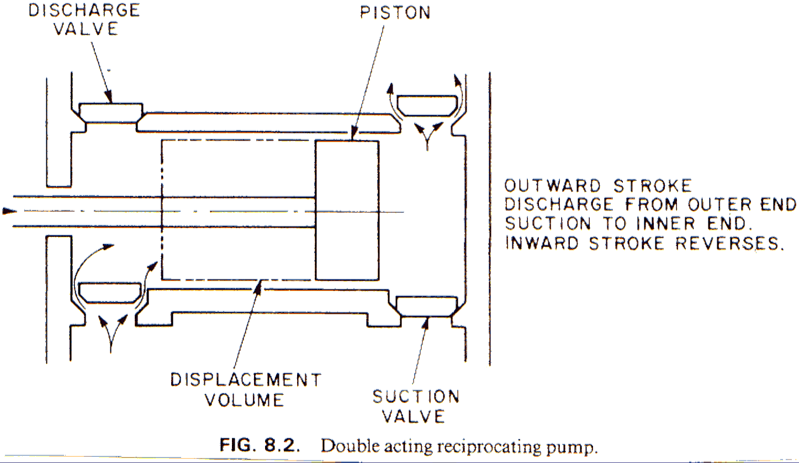
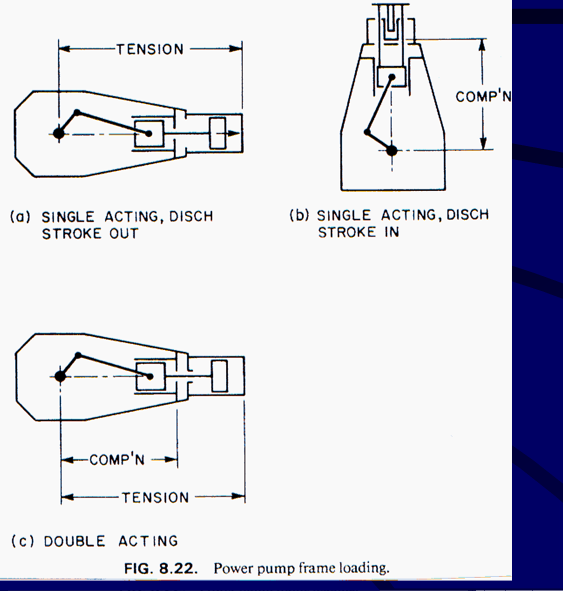
Double-acting operation
Both sides of the piston participate in pumping. In the illustrated outward stroke, discharge occurs from the outer end while suction occurs at the inner end; the valve roles reverse on the inward stroke.
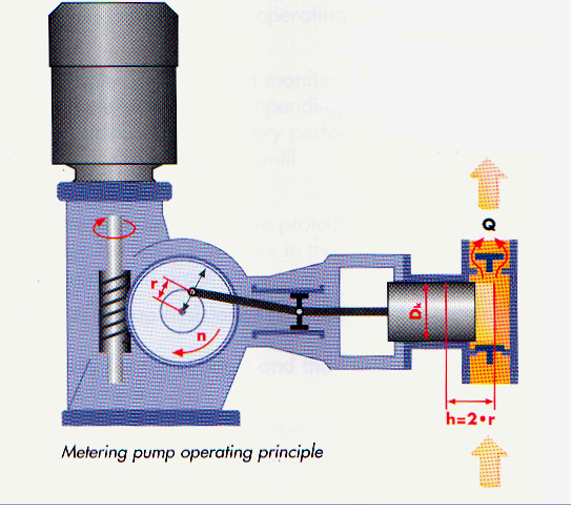
Metering, diaphragm and piston pump construction
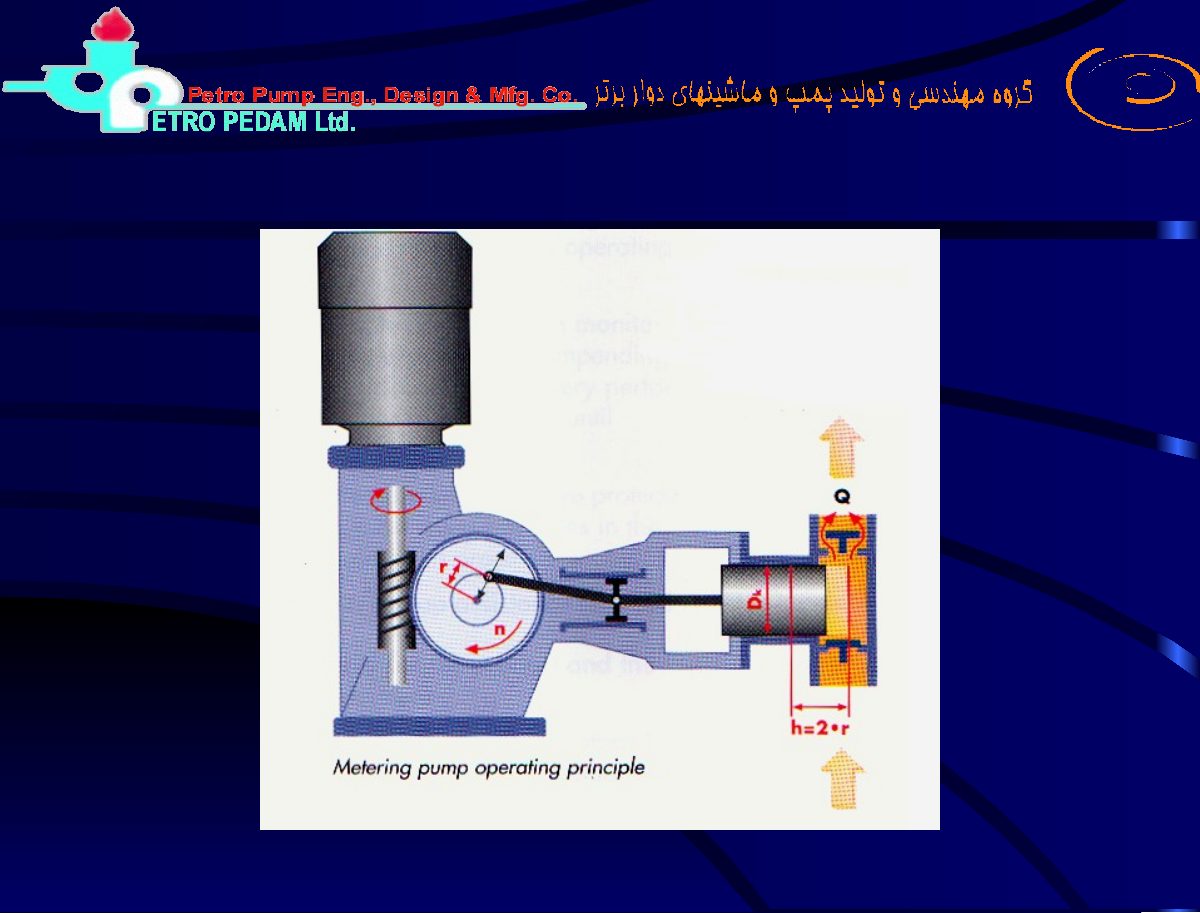
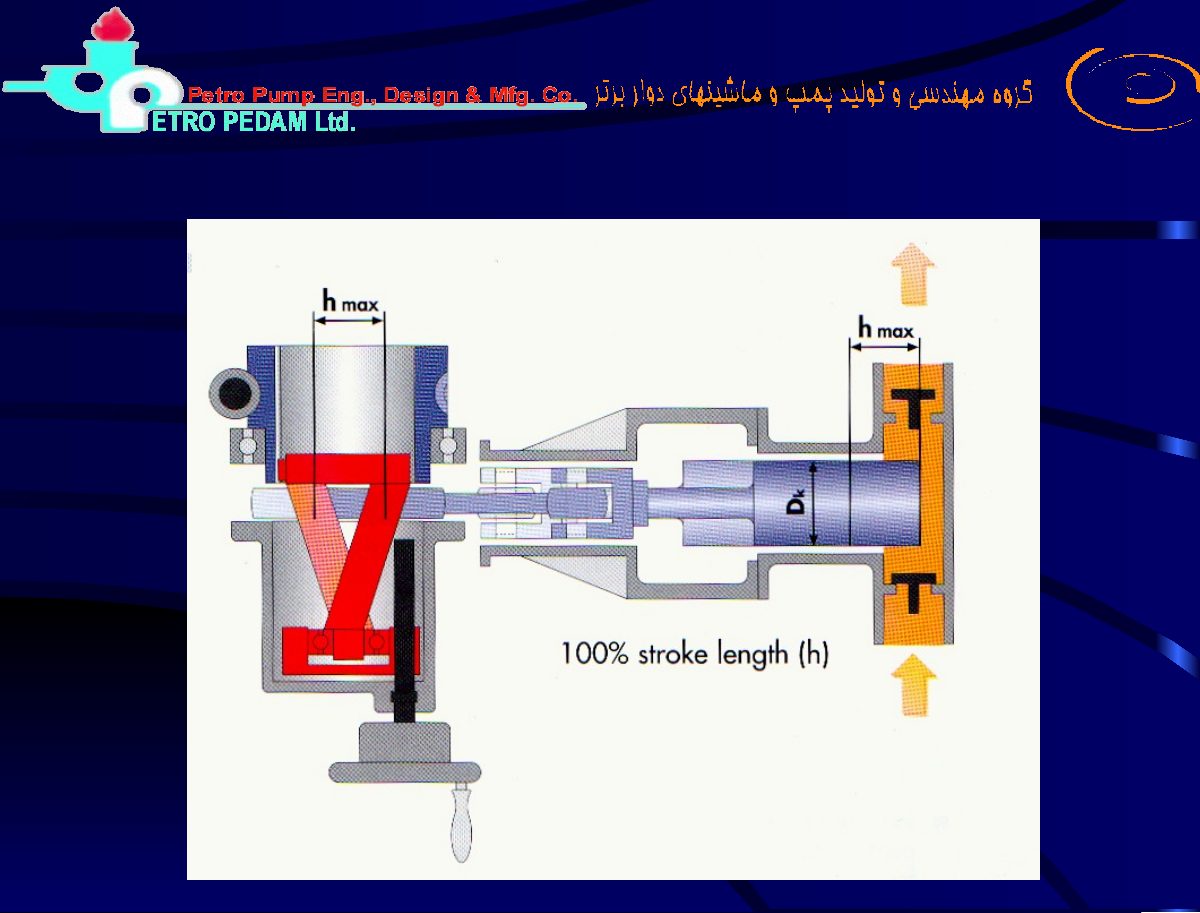
Metering pump motion and stroke length
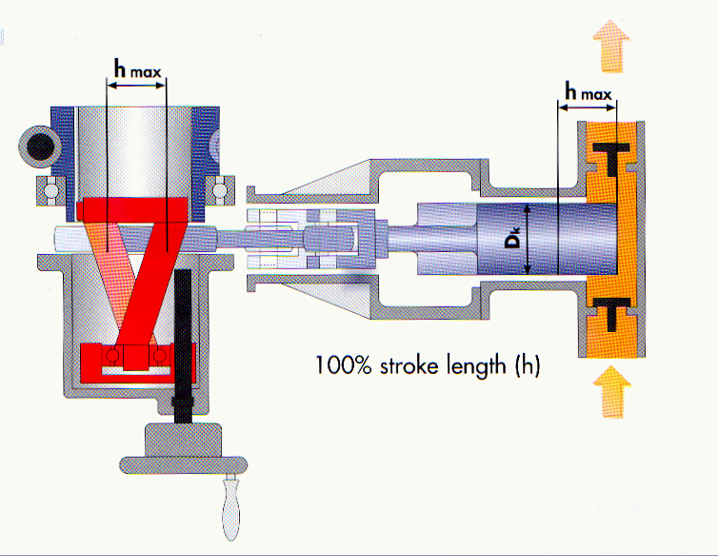
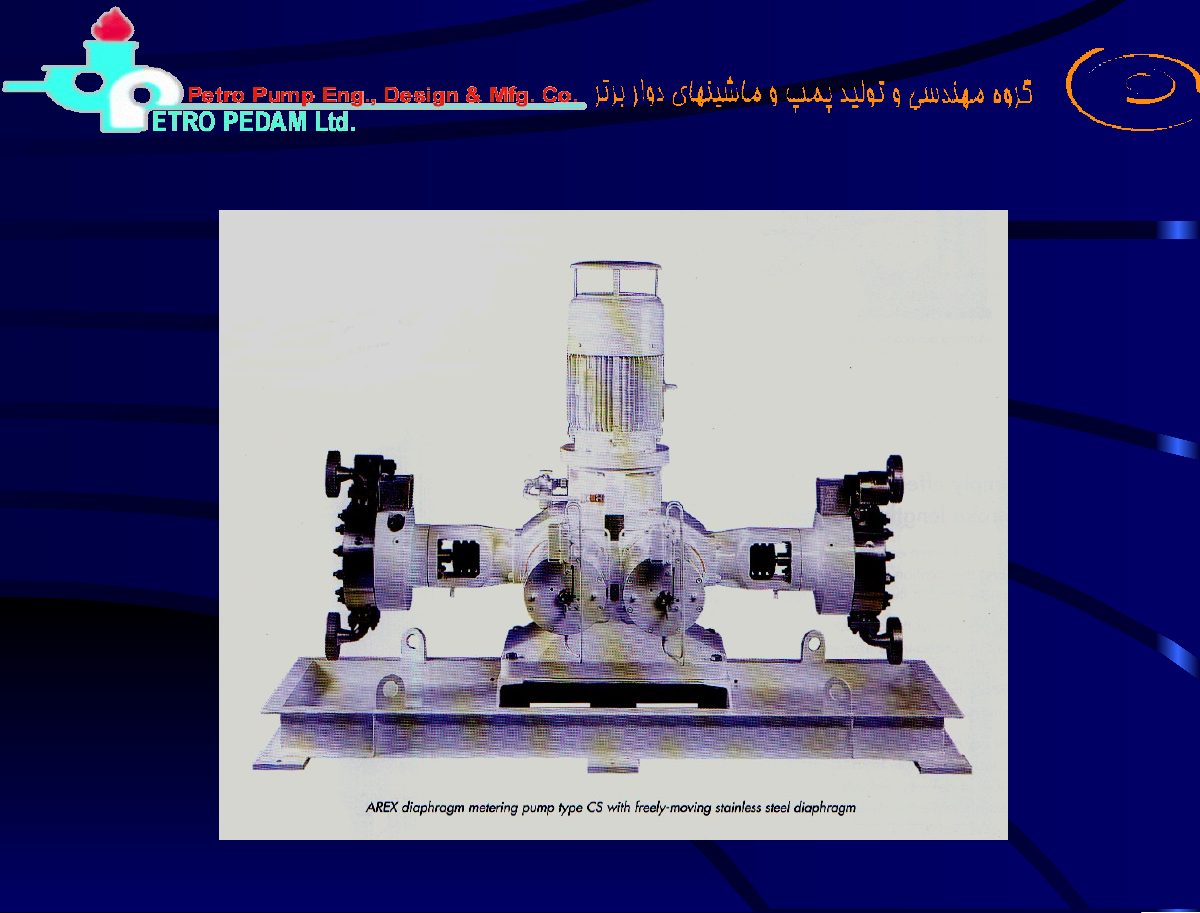
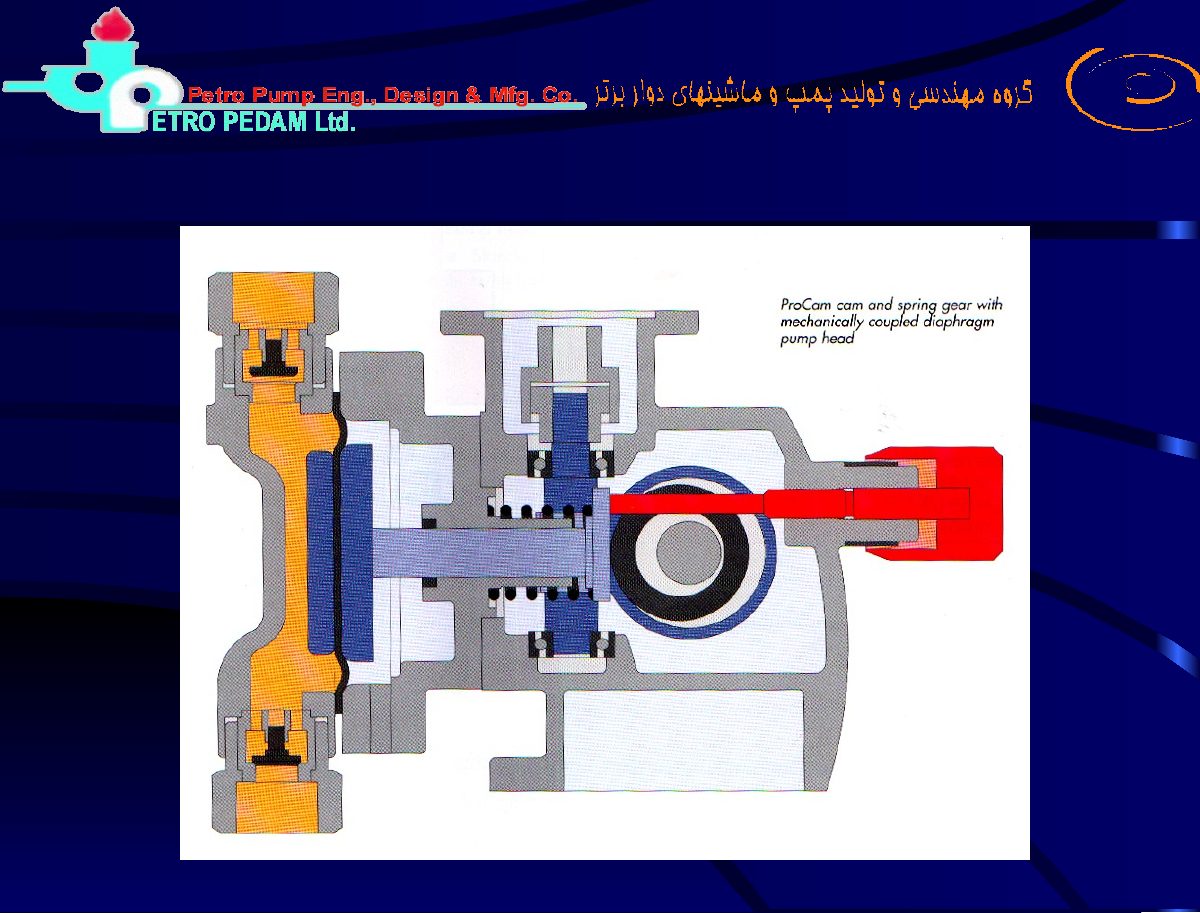
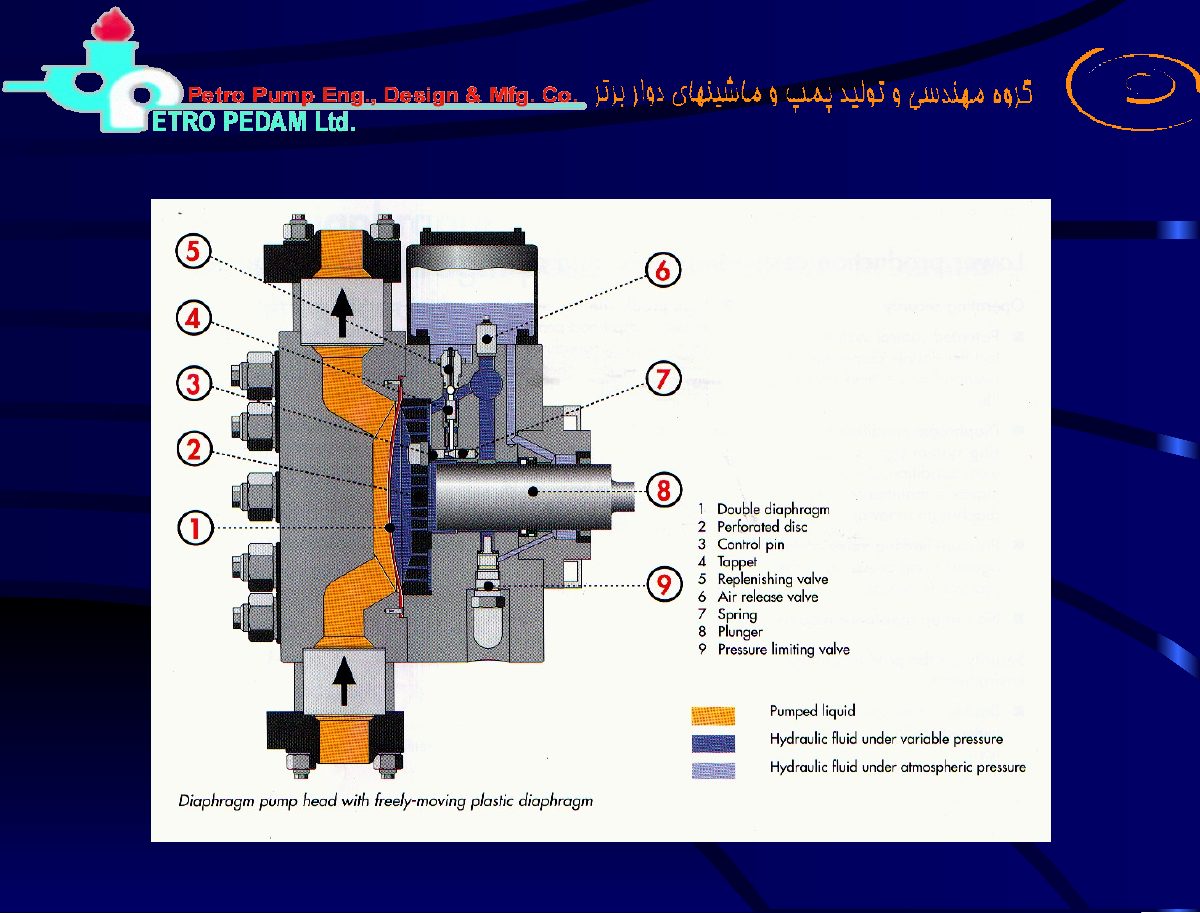
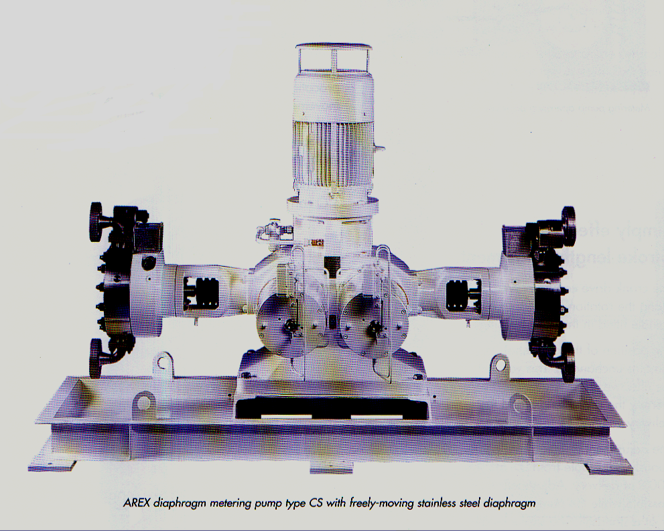
Diaphragm metering pump and drive arrangement
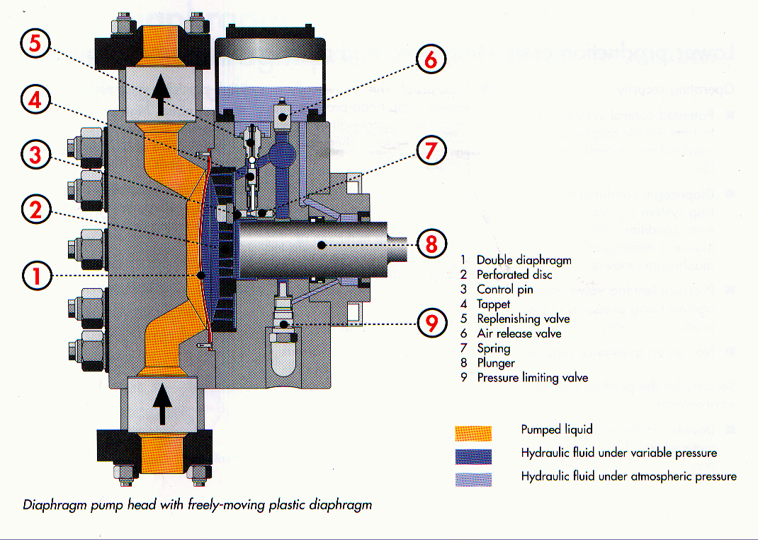
| Number | Part |
|---|---|
| 1 | Double diaphragm |
| 2 | Perforated disc |
| 3 | Control pin |
| 4 | Tappet |
| 5 | Replenishing valve |
| 6 | Air release valve |
| 7 | Spring |
| 8 | Plunger |
| 9 | Pressure limiting valve |
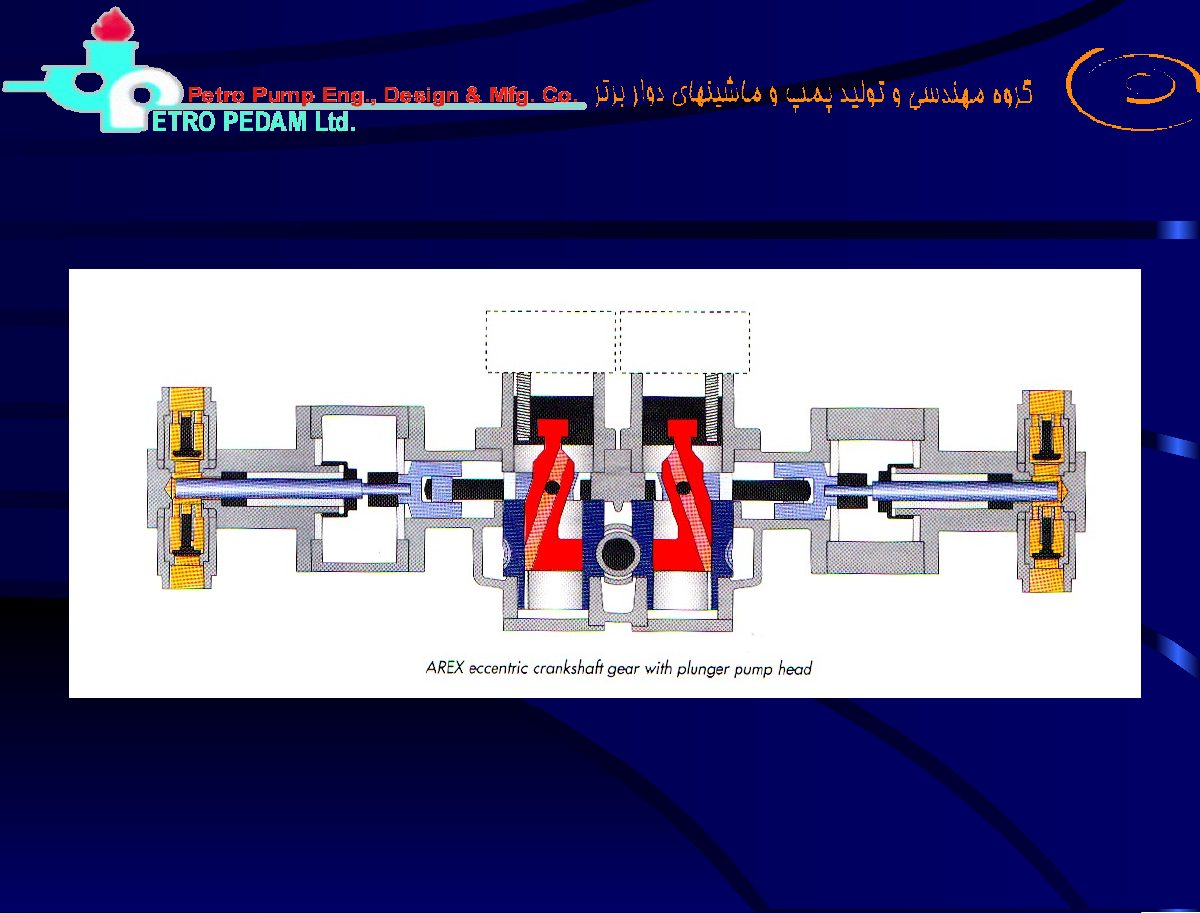
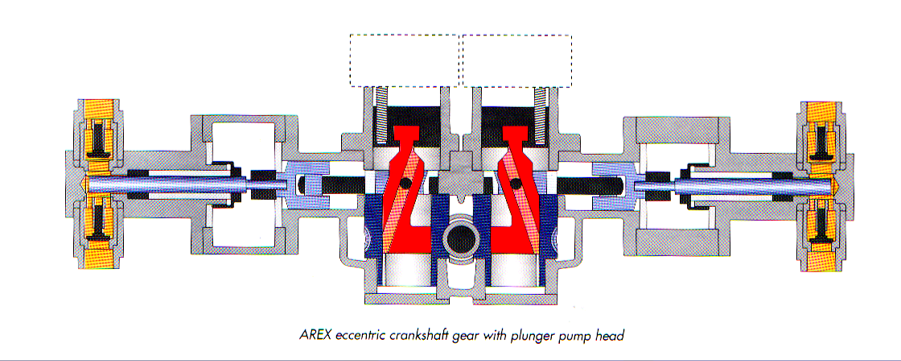
Eccentric crosshead and plunger construction
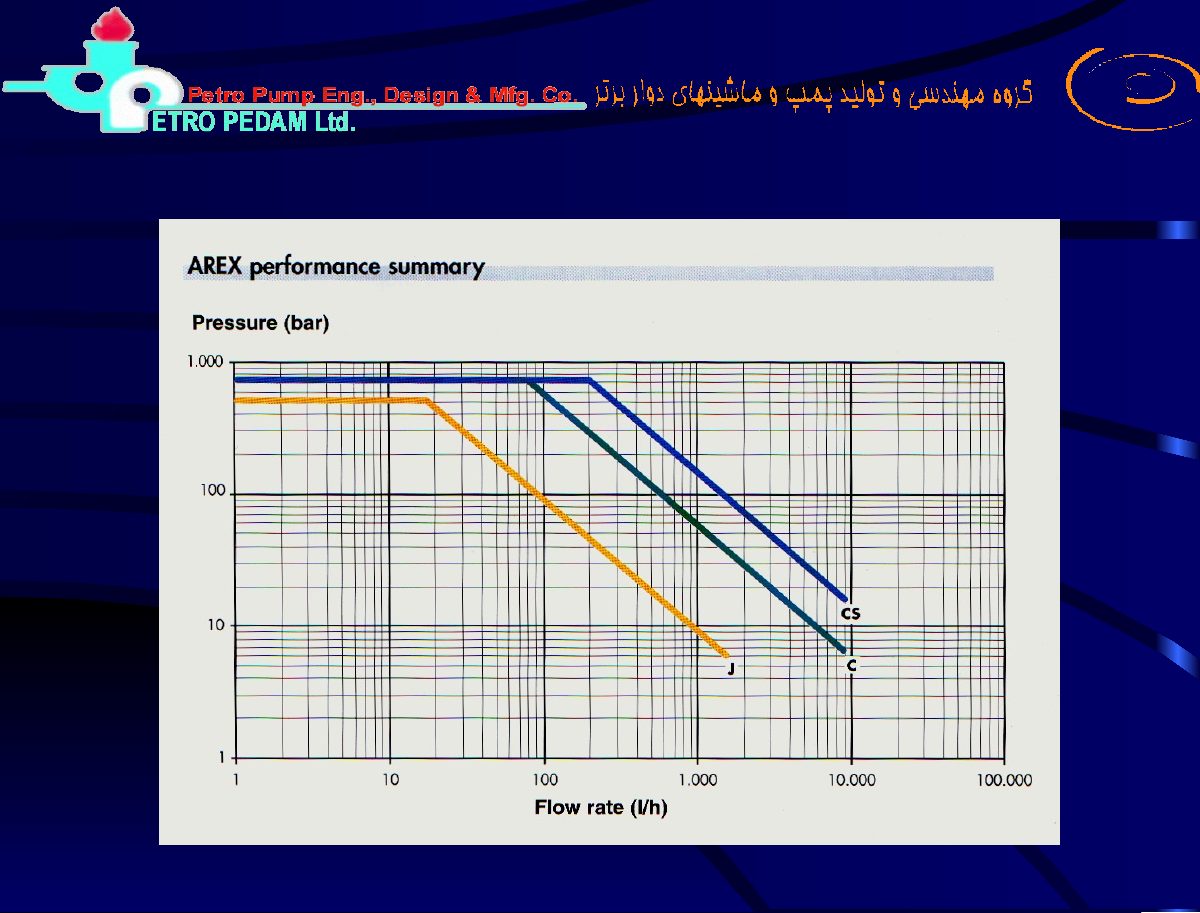
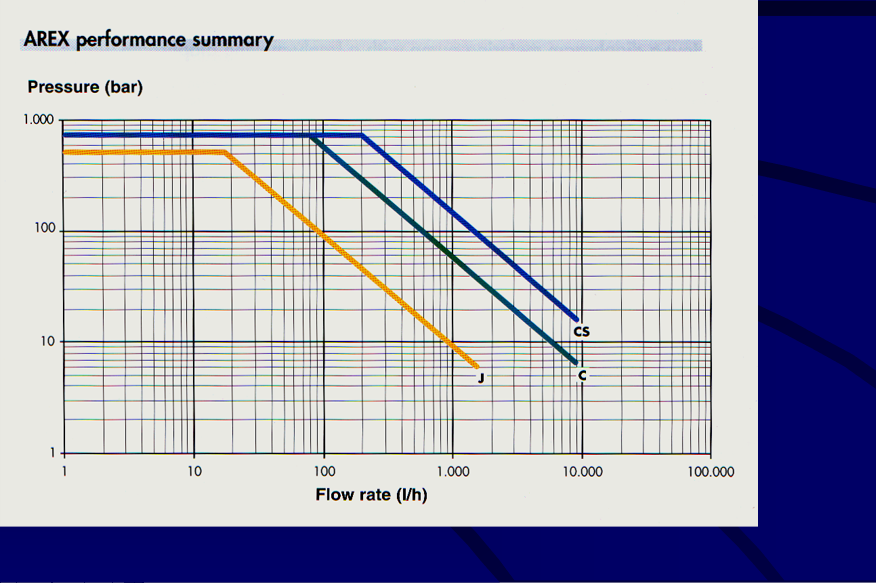
Source performance envelope
Power pump frame loading
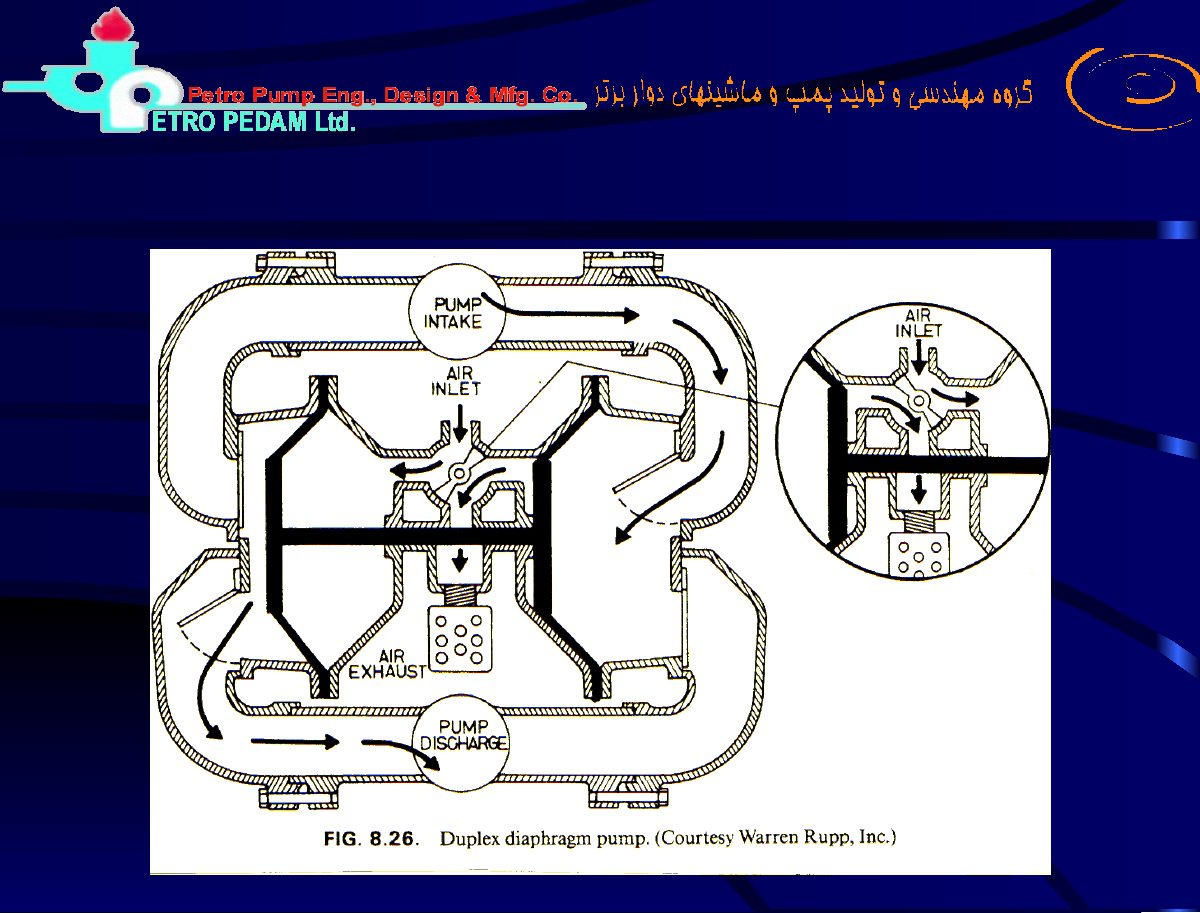
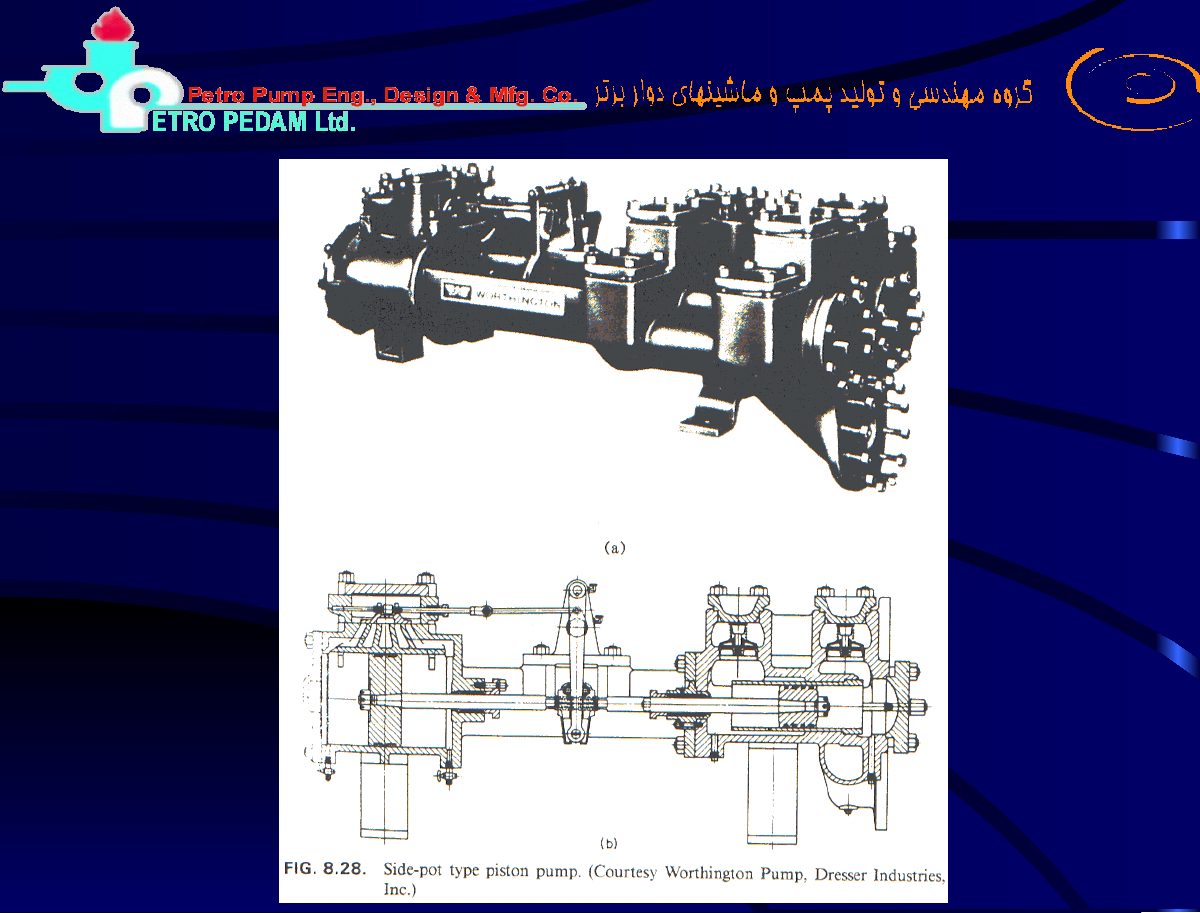
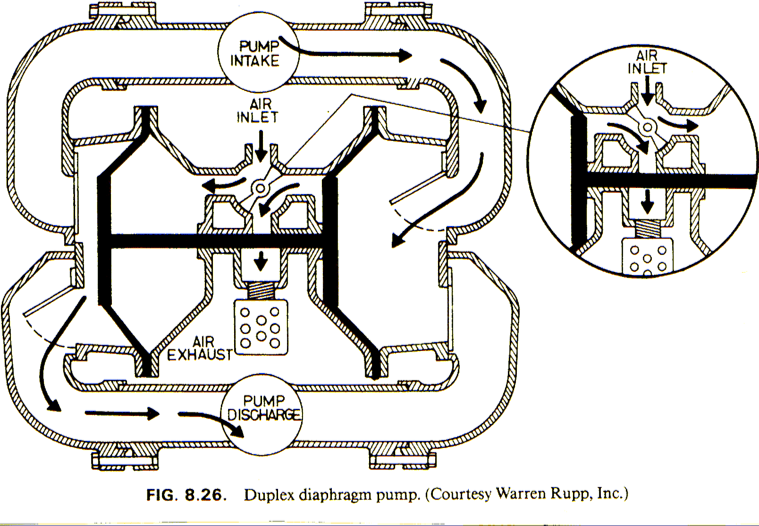
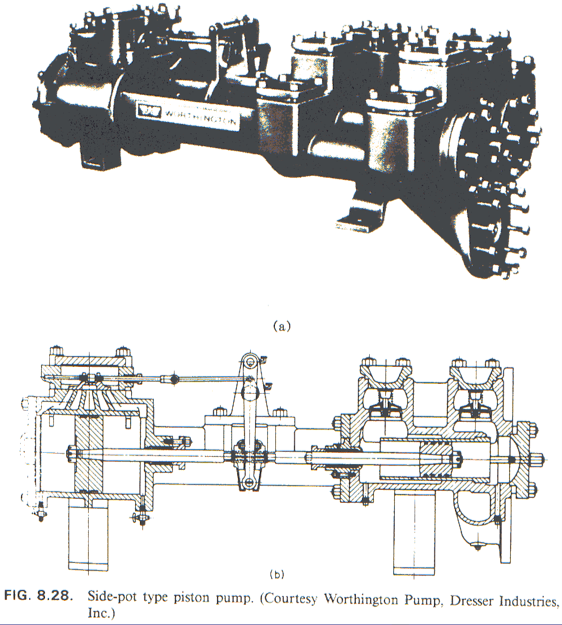
Duplex diaphragm and side-pot piston arrangements
What Changes When the Duty Point Moves Away from BEP?
The training teaching figures distinguish low-flow, preferred and high-flow behavior. These are risks to evaluate, not universal alarm thresholds: the manufacturer's POR, AOR, minimum flow and suction requirements govern for the specific pump.
Low flow
Investigate temperature rise, suction or discharge recirculation, radial loading, seal cooling and minimum continuous stable flow. A bypass can preserve pump flow, but its required capacity must be calculated.
Preferred hydraulic zone
Review the manufacturer's stated POR and all normal operating cases. BEP proximity by itself does not validate suction margin, material choice or mechanical suitability.
High flow
Check required NPSH, power, motor loading and any inlet or discharge limitation. Where conditions vary, verify the full system curve and actual pump operating points.
Engineering basis: Petropedam training material; ANSI/HI 9.6.3 operating regions and ANSI/HI 9.6.1 NPSH margin.
Practical Pump Selection Workflow
A robust selection is a sequence of feasibility checks followed by engineering ranking — not a single lookup by Q and H.
Feasibility gate
Reject candidates that cannot meet duty, NPSH, operating-region, pressure, temperature, material or mechanical requirements.
Hydraulic ranking
Compare BEP proximity, efficiency, NPSHR, impeller trim, curve stability, power and operating envelope.
System ranking
Compare control method, parallel/series behavior, minimum flow, transients and plant operating philosophy.
Lifecycle ranking
Compare energy, maintainability, spares, seal strategy, reliability, inspection/testing and project risk.
When several pumps are hydraulically feasible, Petropedam should present the best selection plus clearly separated alternatives. Do not combine different pump models or speeds into one synthetic performance curve.
API 610 — Centrifugal Pumps for Petroleum, Petrochemical & Natural Gas Industries
Standards status — verified September 2026: API's official Standards Plan lists API 610, 13th Edition, dated June 29, 2026. A project purchase specification may still invoke Edition 12 or another contractual edition; the project document governs.
API 610 establishes minimum requirements for critical process pump design, materials, mechanical integrity, inspection, testing and documentation. It should not be interpreted as making complete pumps universally interchangeable between manufacturers.
OH — Overhung
API 610 includes multiple overhung configurations (OH1 through OH6). Exact construction and driver arrangement depend on the type.
BB — Between Bearings
BB1 through BB5 cover single- and multistage between-bearings configurations, including axially/radially split and barrel-style designs.
VS — Vertically Suspended
VS1 through VS7 cover vertical suspended configurations with different bowl, casing and discharge arrangements.
Stage count: select from required head per stage, hydraulic geometry, efficiency, NPSH, pressure containment, rotor dynamics, axial thrust, maintainability and mechanical limits. Do not impose one universal minimum specific-speed value as a pass/fail criterion.
When API 610 Is Appropriate
Typically considered for demanding petroleum, petrochemical and natural-gas process services where reliability, testing, documentation and consequences of failure justify the standard. For less critical industrial services, other standards/specifications may be more economical if the project permits.
Apply the contractual edition and project supplements. “Current edition” and “project-required edition” are not always the same.
API 674 — Reciprocating Positive-Displacement Pumps
Publication status — verified September 2026: API's published catalog identifies API 674, 3rd Edition (2010). API's Standards Plan lists Edition 4 in development/editing. Do not label Edition 4 as published until API issues it.
API 674 addresses reciprocating positive-displacement pumps for petroleum, chemical and gas-industry services. Reciprocating-pump selection is a system-dynamics problem as much as a pump-rating problem.
Pulsation & Vibration
Evaluate suction/discharge pulsation, acoustic interaction and piping vibration. Pulsation-control devices may be required.
Acceleration Head / Inlet
Valve dynamics and cyclic flow can reduce instantaneous inlet pressure. Size suction piping and evaluate acceleration effects.
Relief & Pressure Protection
A PD pump can continue developing pressure against a blocked discharge. Provide appropriate pressure-relief protection.
Valves, Packing & Materials
Fluid cleanliness, solids, corrosion, lubricity and pressure affect valve, packing/diaphragm and material selection.
Pumps in Parallel & Series
Choose the arrangement by reading the combined pump curve against the system curve, then check every operating combination.
Why consider parallel pumps?
The presentation identifies four reasons to share the flow between two or more pumps:
- The required flow is too large for a suitable single pump.
- Available NPSH is low and flow sharing may permit more suitable inlet hydraulics.
- The service includes sustained, wide changes in required flow.
- The driver required for one pump would be too large.
Each branch shares the common suction and discharge headers and develops approximately the same differential head, allowing for branch losses. At a given common head, add the individual flows: Qtotal = QA + QB. The resulting operating point is the intersection of the combined characteristic and the system curve; two pumps do not automatically produce twice the single-pump operating flow.
Dissimilar pumps can share flow poorly
The source advises against parallel operation of dissimilar pumps in regions where one or both characteristics are flat. One unit can remain at zero contribution until the common head falls sufficiently for it to deliver. This makes the usable curve range, individual shutoff heads and check-valve behavior important.
In the original example, pump B contributes no flow until pump A reaches approximately 35% of its BEP flow. With both pumps running, B's individual contribution is approximately 130% of its own BEP flow, where greater NPSHR and power demand can be expected for the illustrated pump. These percentages describe this example; they are not operating limits for every parallel installation.
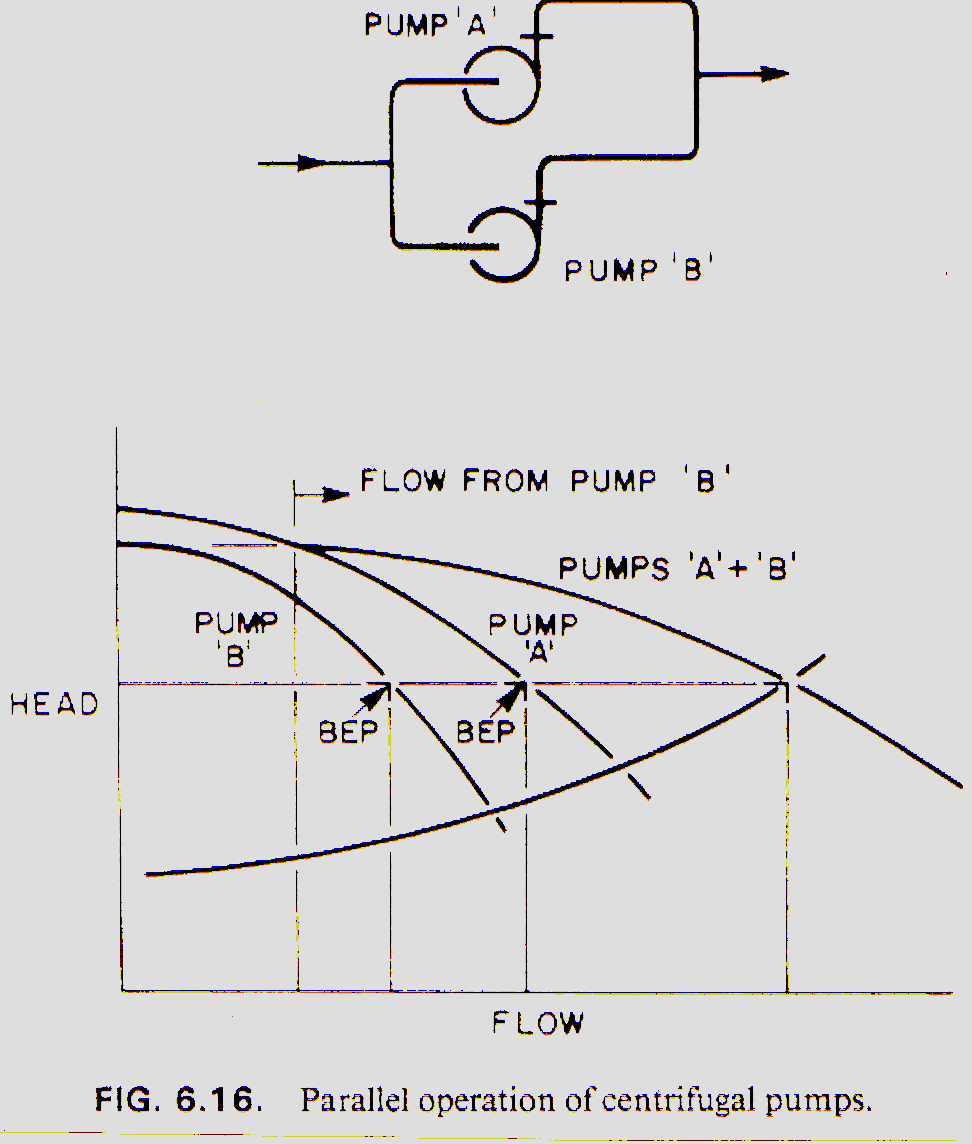
Why consider pumps in series?
The presentation lists five reasons to share the energy rise between pumps:
- The required energy rise is too high for one suitable pump.
- The available NPSH is low and a suitable first pump or booster arrangement is needed.
- The required system head varies widely.
- The initial pressure is high, requiring a carefully chosen pressure-rated arrangement.
- The driver needed for a single unit would be too large.
Series pumping does not by itself solve inadequate suction conditions at the first pump. The first unit must meet its suction requirements; each downstream unit must withstand its higher inlet and discharge pressures.
Series operation depends on the system curve
Without intermediate leakage, branching or withdrawal, the same flow passes through every series pump. At that flow, add the developed heads: Htotal = HA + HB.
The original figure compares a flat, high-static-head system with a steep, friction-dominated system. In the flat-system example, one pump cannot overcome the static head, so no forward flow is obtained until the full series arrangement supplies enough head. This is a condition of the illustrated head levels, not a consequence of every flat system curve. In the steep-system example, adding a pump raises the total head and produces an increased operating flow.
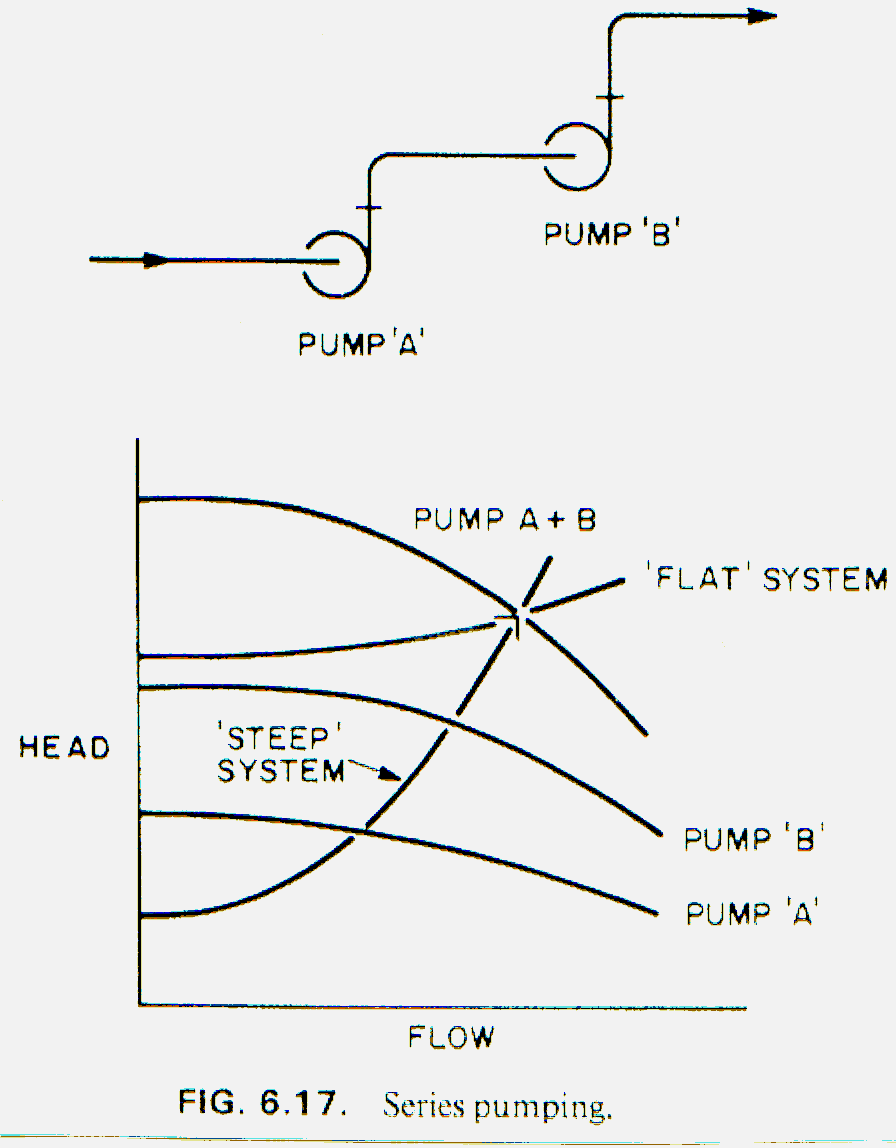
Parallel: check every combination
- Verify individual BEP/POR/AOR, minimum flow, NPSH and driver load.
- Review check valves, start/stop transitions and flow sharing.
- Check common-header losses and suction adequacy with the maximum number of pumps running.
Series: check pressure containment
- Give particular attention to sealing and downstream inlet pressure.
- Verify casing MAWP, seal-chamber limits and transients.
- Review start/stop sequencing and permitted operation with one unit unavailable.
For the operating-point and stability explanation, see Duty and hydraulic stability.
Adjusting Pump Performance and Controlling Capacity
Changing the pump characteristic and changing system resistance move the duty point in different ways.
Impeller diameter and blade setting
The source describes reducing the outer impeller diameter in radial/Francis-type and mixed-flow designs, and changing the blade angle in adjustable axial-flow designs. Diameter adjustment is generally used to match a rated duty rather than as a continuous operating control.
As specific speed increases, the range over which performance can be adjusted by diameter alone generally becomes more restricted. The source also notes that trimming can increase NPSHR in some designs, with this concern becoming more pronounced at higher specific speed. Treat that statement as a design-dependent effect: use the selected pump's actual trim and suction curves.
Diameter scaling at constant speed
These are the preliminary diameter relations shown in the presentation. Its comparison indicates that the calculated trimmed performance can be lower than the actual result and gives an empirical correction chart. Both original figures are retained below. The correction belongs to its historical method and design range; it is not a universal correction for all impellers.
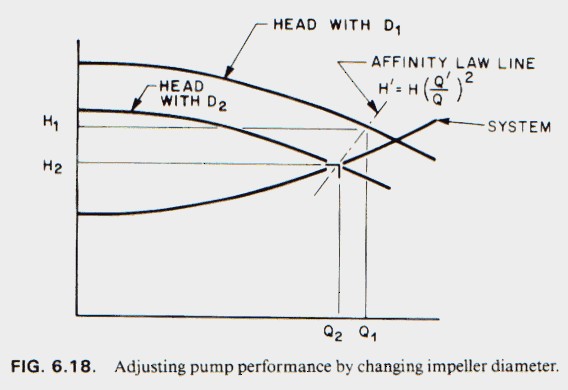
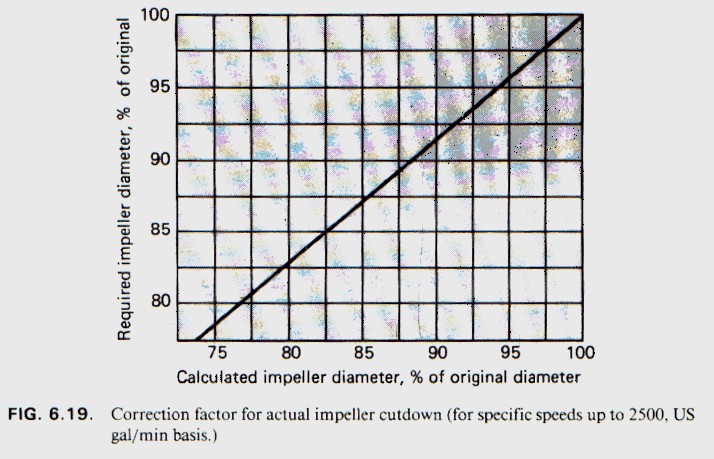
Trimming changes hydraulic geometry, so similarity is approximate. Confirm head, efficiency, absorbed power, NPSHR and the permitted diameter range using manufacturer curves or test data.
Throttling changes system resistance
A discharge control valve increases resistance and moves the intersection along the pump curve toward lower flow. The original example shows reduced pump input power as flow falls, but the valve still dissipates generated head as an additional energy loss. A reduction in power is not universal across radial, mixed and axial designs; review the actual power curve.
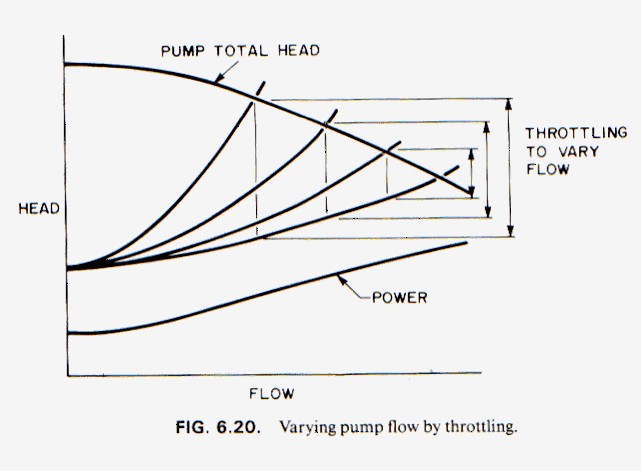
Bypass changes process flow while preserving pump flow
With the bypass closed, the greatest flow enters the downstream process in the source arrangement. Opening the bypass diverts more flow through the return path, reducing process delivery while allowing greater total flow through the pump. With substantial bypass opening, very little of the pumped flow may reach the process.
For the illustrated characteristic, greater bypass opening lowers pump head and increases pump flow and power demand. The main benefit is that reducing process demand need not force the pump into damaging low-flow operation. Review the real characteristic: increasing power is not a universal response for every hydraulic design. Also check recycle heating, suction conditions and minimum-flow protection.
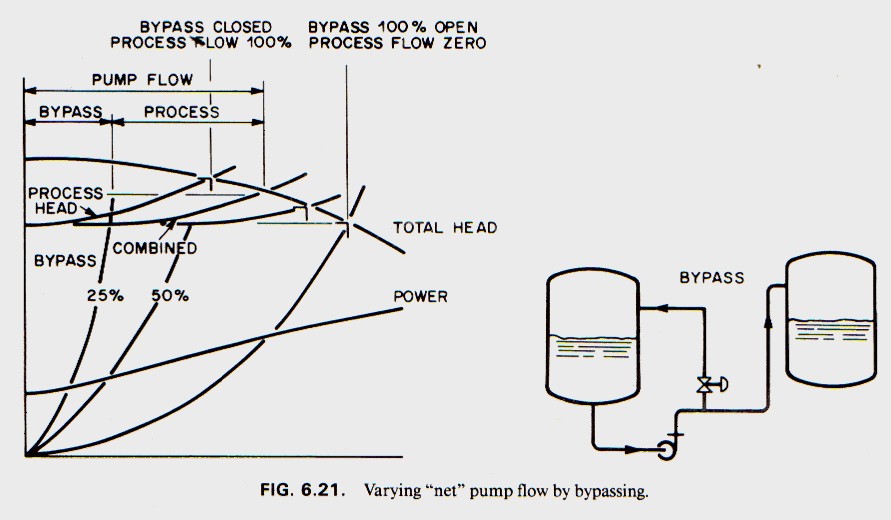
Three performance-adjustment routes in the source
- Impeller diameter: generally a fixed adjustment to match the rated duty.
- Rotational speed: shifts the pump characteristic during operation.
- Available NPSH: the source describes a specialized submergence-control approach for saturated liquid.
In that specialized submergence-control discussion, liquid level in a vessel influences the available suction head and hence the delivered flow. The presentation calls the method uncommon and cites applications with NPSH below 6 ft (approximately 1.83 m). This is historical application guidance, not a general instruction to use cavitation as flow control. Ordinary installations must preserve the required suction margin; this approach requires validated pump and process design.
Speed scaling at unchanged impeller diameter
The source describes speed change as the more common performance-adjustment route. It gives N₂/N₁ ≥ 0.5 as the range in which its speed-scaling estimates have acceptable accuracy without an additional correction. Retain that value as the presentation's approximation range, not as a universal allowable minimum speed or an accuracy guarantee.
Apply the relationships to corresponding points on the pump curves. Find the actual new operating point from the unchanged or modified system curve. Verify efficiency, suction performance, driver/VFD limits, cooling and mechanical operating restrictions.
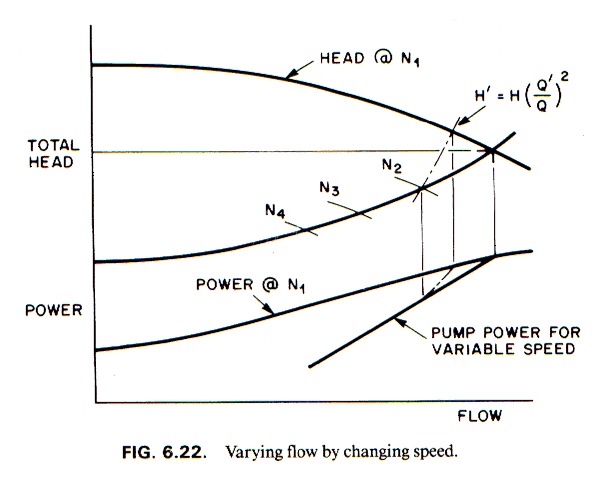
Why variable speed can reduce control losses
Throttling creates additional resistance. Speed control changes the generated head instead. The energy benefit depends on the static-head fraction and the operating profile; assess the actual system rather than assuming a fixed saving.
Cross-checks: Hydraulic Institute — Pump Curves; KSB — Impeller Trimming. Original diagrams and historical examples: Petropedam engineering training material.
Speed control, BEP and suction requirement
The presentation highlights two benefits of speed adjustment compared with throttling: the duty can remain closer to the appropriate BEP, and the pump can generate energy closer to the process requirement. It particularly emphasizes potential savings when the required flow varies substantially. These benefits depend on the system curve and duty profile; a high static-head fraction can move the operating point away from the scaled BEP.
For suction performance, the source gives the following historical speed approximation:
Retain the exponent 1.7 as the presentation's empirical approximation, not as a universal NPSHR law. Recheck the manufacturer's suction curves at the new speed and corresponding flow, and apply the service-specific margin.
Operating Limits and the Effects of Varying Flow
Different mechanisms govern different parts of the flow range. Establish continuous and intermittent limits for the actual pump, liquid and operating conditions.
As a centrifugal pump operates across different flows, inlet, outlet, thermal and mechanical effects can each restrict the allowable range. The source emphasizes pump design, liquid properties and rotor energy as the factors determining how strongly each effect matters. The following original overview places these mechanisms on a common flow axis; the marked regions are teaching examples rather than universal alarm settings.
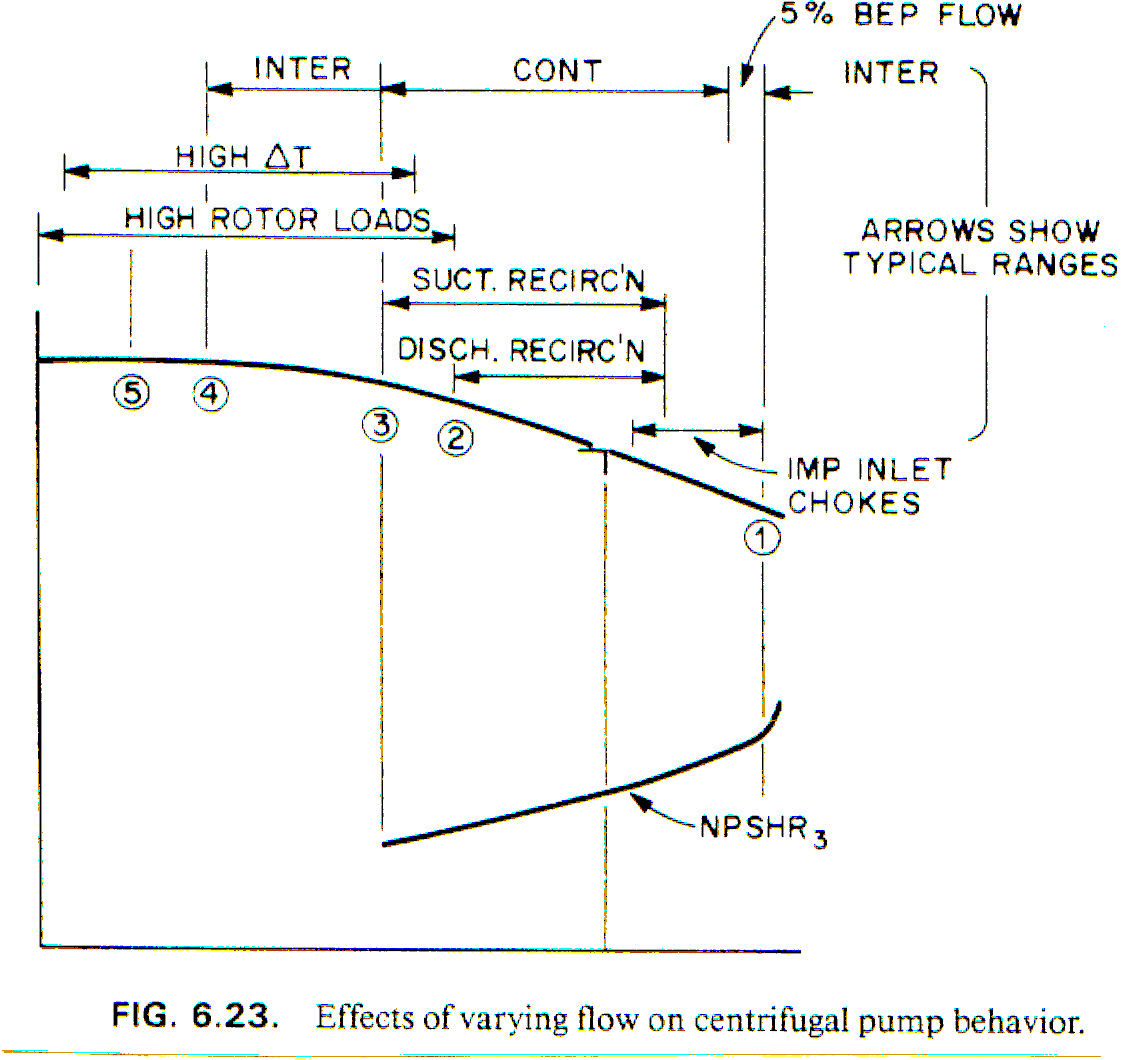
Inlet choking and discharge recirculation
Inlet choking: at high flow, limited passage area between the impeller blades and increased inlet velocity can cause the required suction head to rise sharply. The source associates choking with approximately 105% of BEP flow for high suction specific speed through 130% for low suction specific speed. These are historical comparison values, not a universal allowable-flow band.
Discharge recirculation: secondary and reverse flow at the impeller outlet can wear the shroud fillet, contribute to shroud fracture and produce fluctuating radial and axial thrust, described in the presentation as rotor shuttle. The source places onset around 70% of BEP flow for a low-efficiency design, while the illustrated better designs can place it beyond BEP. Onset and severity require pump-specific assessment.
Suction recirculation and rotor loading
Suction recirculation: reverse flow around the impeller-eye region can produce surging, vibration, cavitation-like noise and impeller erosion. Its relationship with suction specific speed is important. The source compares onset around 50% of BEP flow at low suction specific speed with onset beyond BEP at high suction specific speed. These source values describe design sensitivity rather than a single minimum-flow rule.
Rotor loads: steady and fluctuating hydraulic forces depend on both hydraulic and mechanical design. Rotor deflection may damage seals and disturb shaft/bearing clearances. The source illustrates a rotor-load-limited low-flow region extending from the start of the curve to roughly 50% of BEP flow; the actual limit must come from the chosen design.
Temperature rise at low flow
Energy losses in the pump heat the liquid. As flow decreases, the same heat input can act on less liquid, increasing temperature rise and vaporization risk. Heated liquid may remain liquid in a higher-pressure region but vaporize when internal leakage returns it toward the lower-pressure suction region, reducing developed head.
The original presentation reports the following temperature-rise expression:
Its legend calls H leakage head, η decimal efficiency and Cp specific heat. The factor 778 indicates a US energy-unit conversion. The supplied expression is retained as source notation; its head and heat-accounting basis must be established before calculation. Do not insert SI units into this expression or treat all developed hydraulic head as heat.
For an explicitly defined heat balance, an engineering estimate is ΔT = Pheat / (ṁ × cp), with heat transferred to the liquid in W, liquid mass flow in kg/s and specific heat in J/(kg·K). Identify the relevant losses and recirculation path. For shutoff or a closed recycle volume, use a transient heat balance and the manufacturer's minimum-flow method.
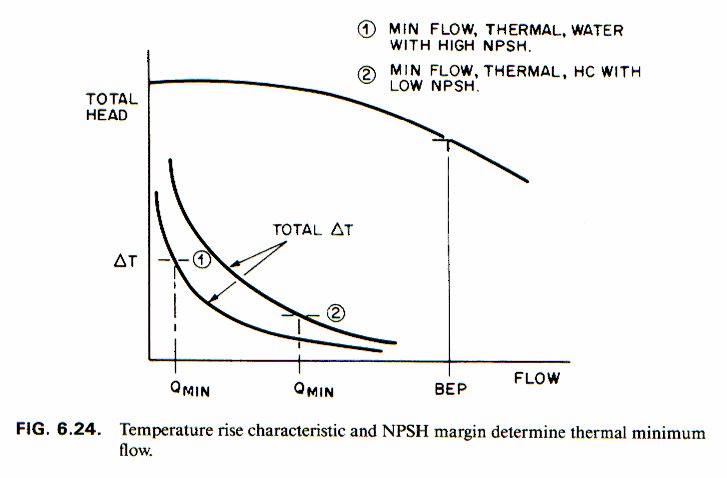
Continuous and intermittent allowable flow
The source distinguishes continuous and intermittent operation. A brief permitted excursion is not approval for sustained operation. The original wear-rate figure shows why operation away from the favorable region can shorten service life, with the trend depending on energy level.
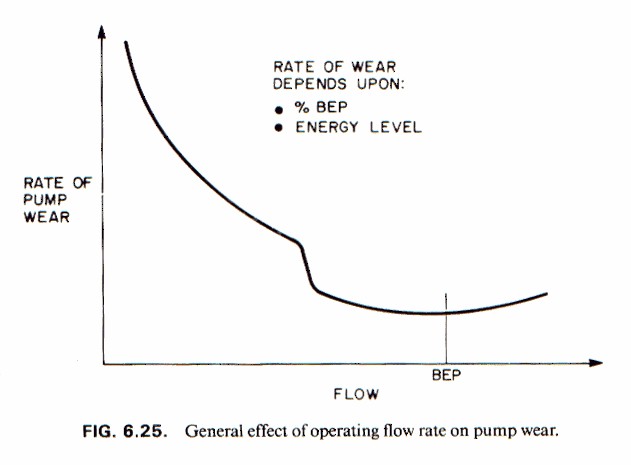
Choosing a minimum-flow bypass
A bypass is commonly used to prevent the pump from entering the lower intermittent operating region. If the continuous and intermittent minimum-flow limits are close, or if extended operation below the continuous limit would otherwise occur, the source calls for sizing the bypass to preserve the minimum continuous flow.
Defining the range is difficult because the mechanisms overlap and off-BEP behavior varies between designs. A limiting phenomenon for one pump may not govern another. Establish the governing thermal, hydraulic and mechanical limits rather than copying a percentage.
Historical flow-limit guidance retained from the source
| Source guidance | How to use it in selection |
|---|---|
| Maximum intermittent flow should remain short of the sudden steep rise in NPSHR; maximum continuous flow is separated by about 5% of BEP flow. | The 5% is a flow separation, not a 5% NPSH margin. Confirm actual continuous and intermittent boundaries. |
| Minimum continuous flow is related to suction-recirculation onset; the source gives 60% of that flow for hydrocarbon service. | The 60% refers to the stated recirculation-related flow, not automatically 60% of BEP. Confirm fluid-specific acceptability. |
| The one- and two-stage example identified as 100 hp per stage has the same continuous and intermittent minimum flow. | Retain as a source example; it does not establish an all-pump power threshold. |
Which mechanism sets the minimum?
- Rotor loads and temperature rise commonly govern the intermittent minimum in the source discussion.
- If the thermal limit extends beyond the otherwise allowable continuous minimum, the thermal limit becomes the governing continuous minimum.
- In high-speed single- or multistage designs, rotor loads can govern both continuous and intermittent minimum flow.
- The required head rise for stable operation, motor power in high-specific-speed designs, and the need to handle liquid containing gas bubbles can also determine the required bypass flow.
Combine these constraints with the manufacturer's permitted operating duration, POR/AOR, suction margin, seal cooling and process requirements. The historical percentages above preserve the teaching material; they do not replace manufacturer operating limits.
Further off-design checks
Three radial-load mechanisms
- Steady radial thrust: nonuniform pressure around a single volute during off-design operation, asymmetric pressure distribution in a double volute, or an eccentric diffuser can create a net radial force.
- Fluctuating radial loads: secondary flow and pressure pulsations at the impeller outlet can generate time-varying forces.
- Low-frequency rotating forces: diffuser stall can create a rotating hydraulic disturbance.
Viscosity changes the hydraulic performance
The source identifies greater frictional losses, thicker boundary layers that change effective passage geometry, reduced developed head and efficiency, and increased power demand. It notes stronger efficiency penalties at low specific speed. The original figure compares performance at different viscosities; use a recognized viscosity-correction method and verified liquid properties at operating temperature.
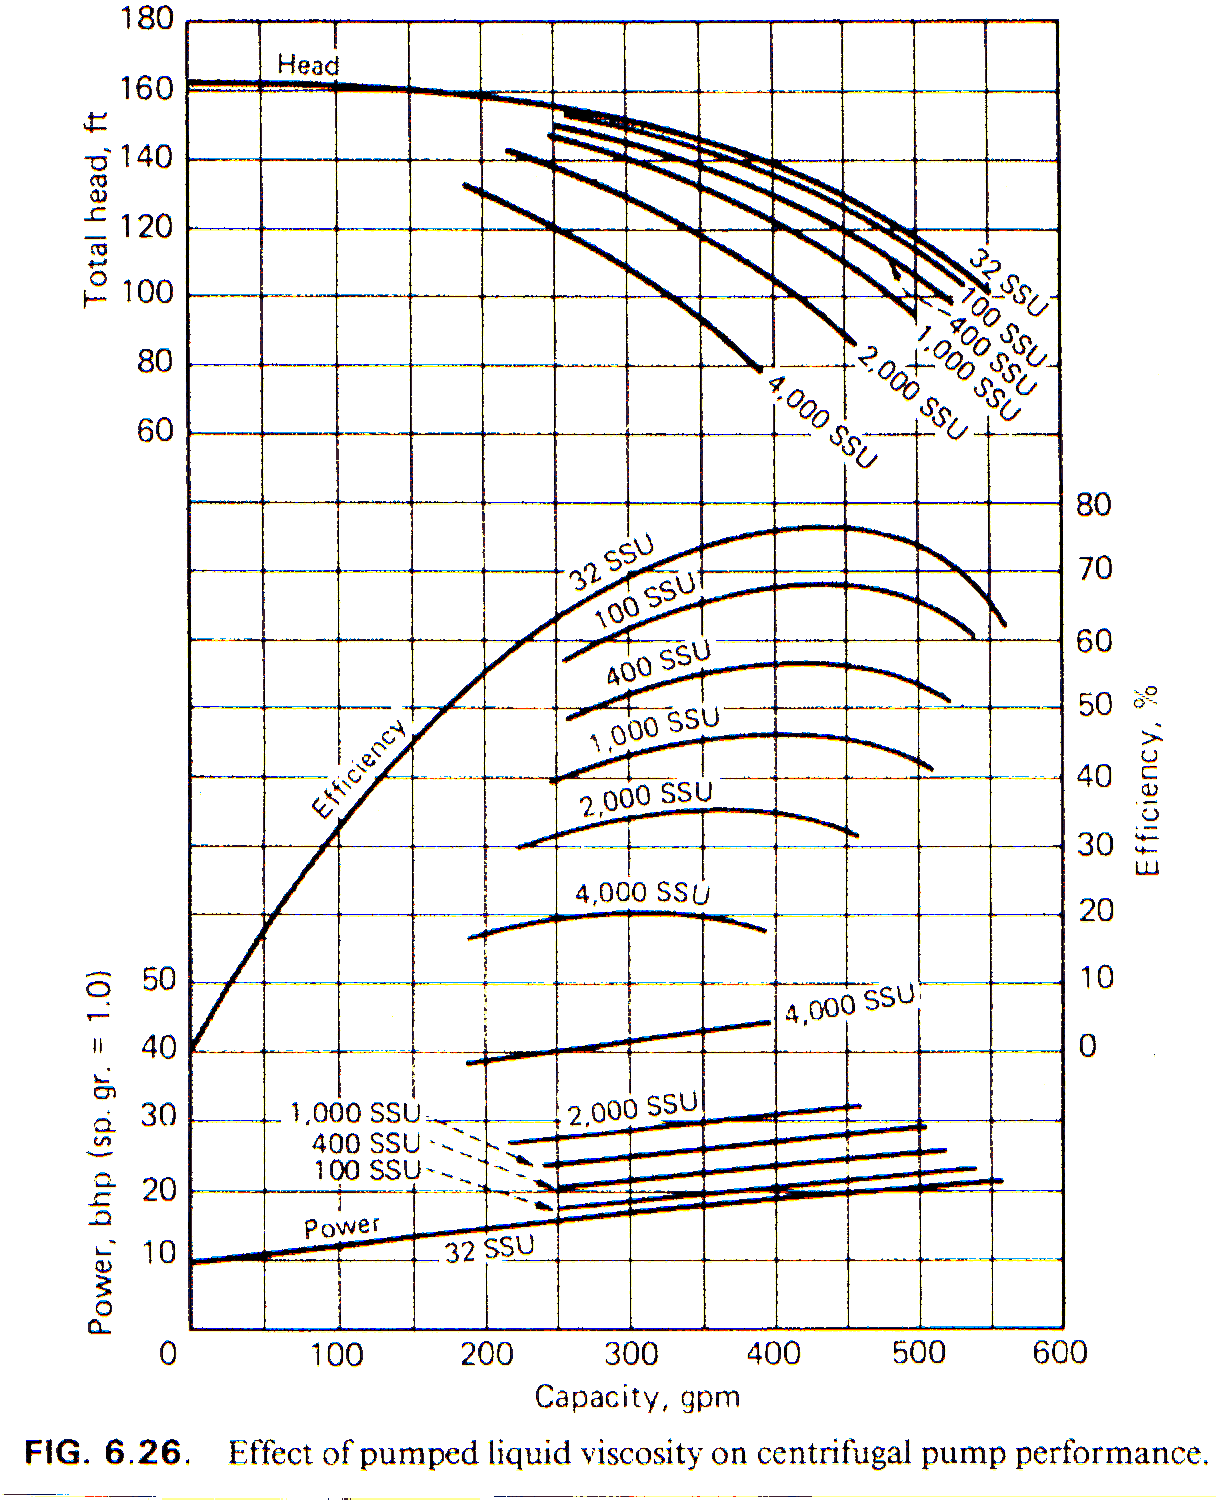
The presentation states a historical screening ceiling of 500 SSU for centrifugal pumping. This value is retained as source guidance, not a universal prohibition. SSU is temperature-dependent efflux time and is not numerically interchangeable with cSt. Technology choice requires viscosity at the actual temperature, hydraulic corrections, efficiency and lifecycle assessment.
Entrained gas changes the head curve
The source chart compares 1–6% gas by volume with gas-free liquid and shows changing developed head and minimum-capacity behavior. The effect depends on hydraulic design, gas fraction at suction conditions, pressure and liquid properties; the plotted percentages are test comparisons rather than generic gas-handling ratings. Distinguish free/entrained gas from dissolved gas and cavitation vapor.
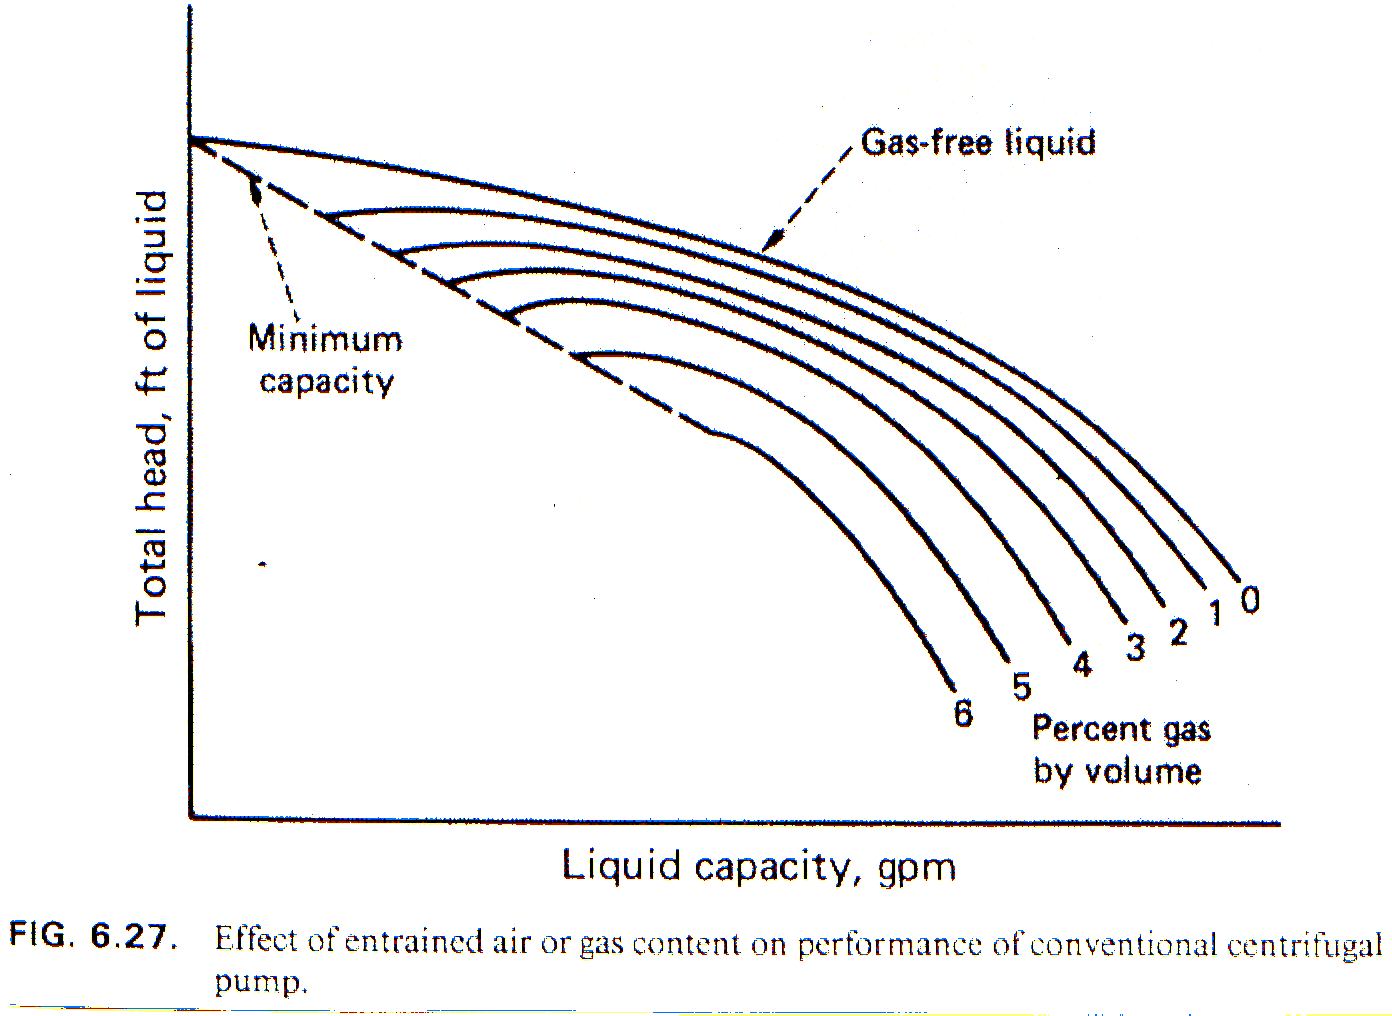
Cross-check: Hydraulic Institute — NPSH and operating regions. The applicable operating-region guidance and manufacturer limits govern the final selection. Original diagrams and historical examples: Petropedam training material.
Have a real duty point?
Use the Pump Selection Software to screen Petropedam candidates, then verify NPSH, operating region, power and construction against the project requirements.
Petropedam Project References
Selected company project references supplied by Petropedam, spanning Oil & Gas, Refinery, Petrochemical, Mining and Water services.
Selected Project Highlights
| Year | Project No. | Customer | Pump Model | Liquid | Flow (m³/h) | Head (m) | Power (kW) | Standard |
|---|---|---|---|---|---|---|---|---|
| 1401 | OPS-P-ME-403039 | Jondi Shapour | KND1450-175*2 (BB1) | Heavy Crude Oil | 1441.3 | 347.5 | 2000 | API 610 |
| Under Fab | G26S1-PRC-VCNT-PWW22 | Gohar Mes | MHG4 (BB4, 6 Stage) | Raw water | 248 | 580 | 800 | API 610 |
| 1401 | 1208-00-RE-POR-313A | PIDEC | Triplex Plunger TH 100 | Ammonia to Urea | 1.4-5.6 | 1124 | 37 | API 674 |
| 1400 | RTP-7700496287-RT | Tehran Refinery | Screw Pump W7T.3Z85 | Vacuum Residue | 163 | — | 75 | API 676 |
| 1401 | 110052/01-77 | MMTE | BB1 CS250-600/4 | Process Water | 1095 | 91.2 | 450 | API 610 |
| 1400 | 41-106/1996 | Mobin Petrochemical | MHP70H-3 (VS4) | Sea Water | 162 | 25 | 30 | API 610 |
| 1401 | 40-90-0052400020/P08 | Abadan Refinery | Reciprocating 1500 (545) | Fuel Sludge | 18.2 | — | 15 | API 674 |
| 98 | Potable Pump | Tana Energy | Warman PGr300 | Potable Water | 1100 | 118 | 560 | DIN |
| 94 | 94/1/5878 | FRW ORG | Fire Fighting Pump | Water & Foam | — | 200 | 14 HP | NFPA |
Full project reference list and current company totals are available from Petropedam upon request.
Pump Selection Checklist
Use this checklist before a pump is released for quotation or final specification.
Standards, References & Engineering Basis
The original Petropedam PowerPoint provides the training framework; edition-specific rules and legacy rules-of-thumb have been reviewed against current published information.
- API 610, 13th Edition — 29 June 2026 — Centrifugal Pumps for Petroleum, Petrochemical and Natural Gas Industries (API Standards Plan).
- ANSI/HI 9.6.1-2024 — Rotodynamic Pumps Guideline for NPSH Margin.
- ANSI/HI 9.6.3-2024 — Rotodynamic Pumps — Guideline for Operating Region(s).
- ANSI/HI 9.6.7-2021 — Rotodynamic Pumps — Guideline for Effects of Liquid Viscosity on Performance.
- ANSI/HI 9.6.6-2022 — Rotodynamic Pumps for Pump Piping.
- ANSI/HI 9.8-2024 — Rotodynamic Pumps for Pump Intake Design.
- API 674, 3rd Edition (2010) — published reciprocating positive-displacement pump edition identified in API's catalog; Edition 4 is listed by API as in development/editing.
- API 676, 4th Edition — 2 February 2022 — Positive Displacement Pumps — Rotary.
Engineering disclaimer: This guide supports education and preliminary selection. Final pump selection must be verified against the certified pump curve, contractual project specification/edition, actual fluid data, site conditions, materials, mechanical limits, applicable standard and vendor documentation.
Frequently Asked Questions
From Pump Selection to Engineered Solution
At PetroPedam, we don't just select pumps — we engineer complete pumping systems.
System Analysis
Hydraulic system analysis, including system-curve development and, where required by the service, transient or surge evaluation.
Material Selection
Corrosion analysis and material optimization for fluid compatibility, with full trace element evaluation.
Sealing Solutions
Seal-system selection for leakage-sensitive or hazardous services, including API 682 requirements where applicable to the project.
Lifecycle Support
Maintenance planning, spare parts strategy, performance monitoring, and reliability optimization.
Complete original engineering presentation
All 166 pages of Petropedam’s original training presentation are reproduced in their original order and colors. The source is in Persian. Tap or click an image to inspect the original figures and wording at full resolution. The English engineering guide above provides the reading path and technical context.
These original pages document the company’s teaching material. Equations, examples and legacy numerical rules must be checked against current standards and the selected pump’s certified data before use in a project.
Original pages 1–12
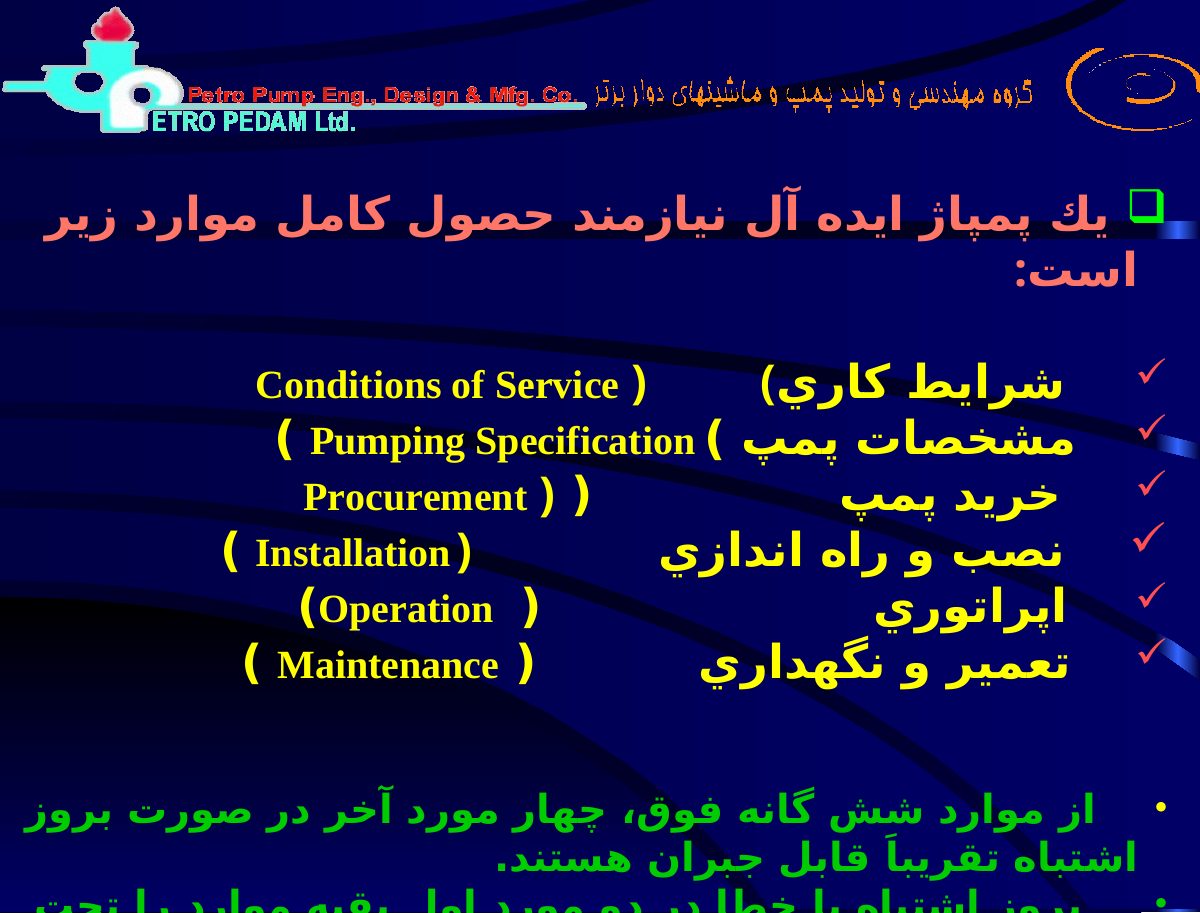
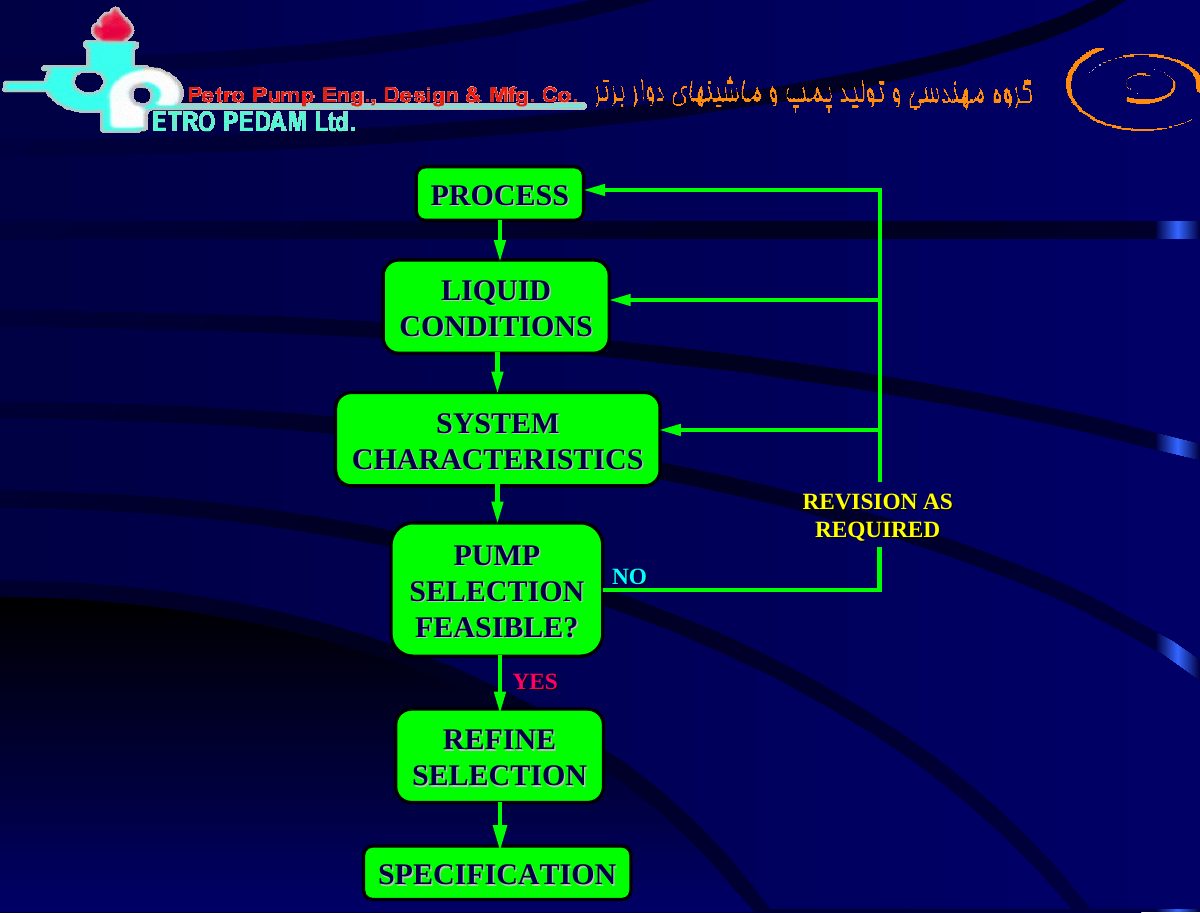
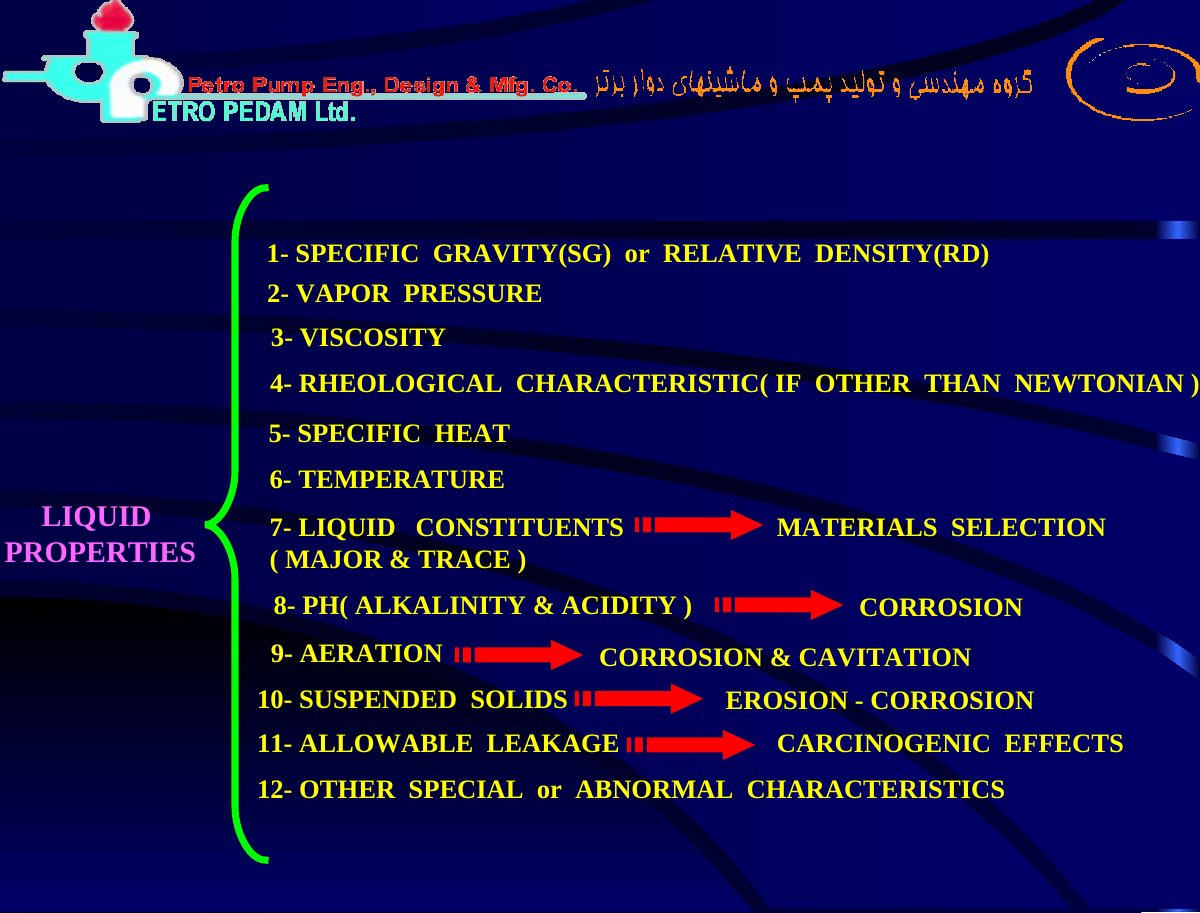
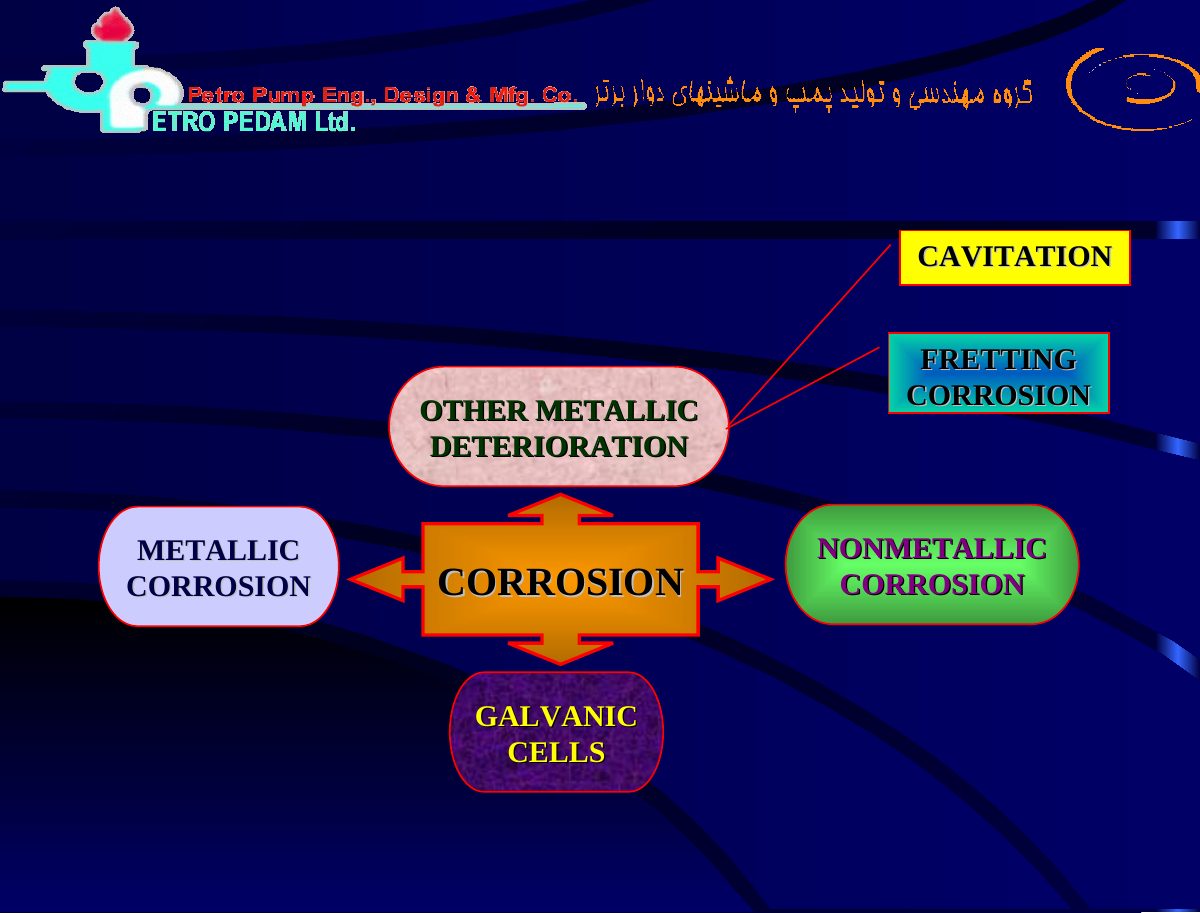
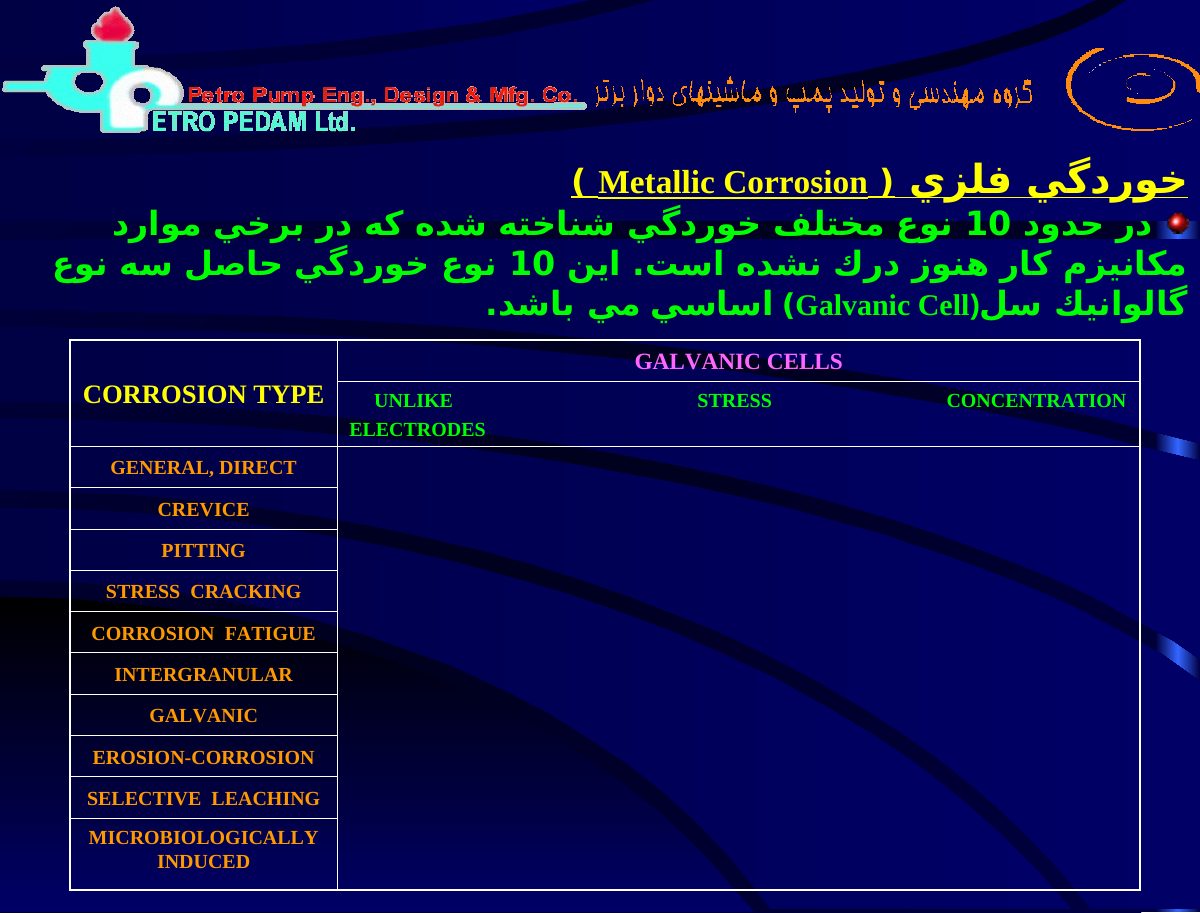
Original pages 13–24
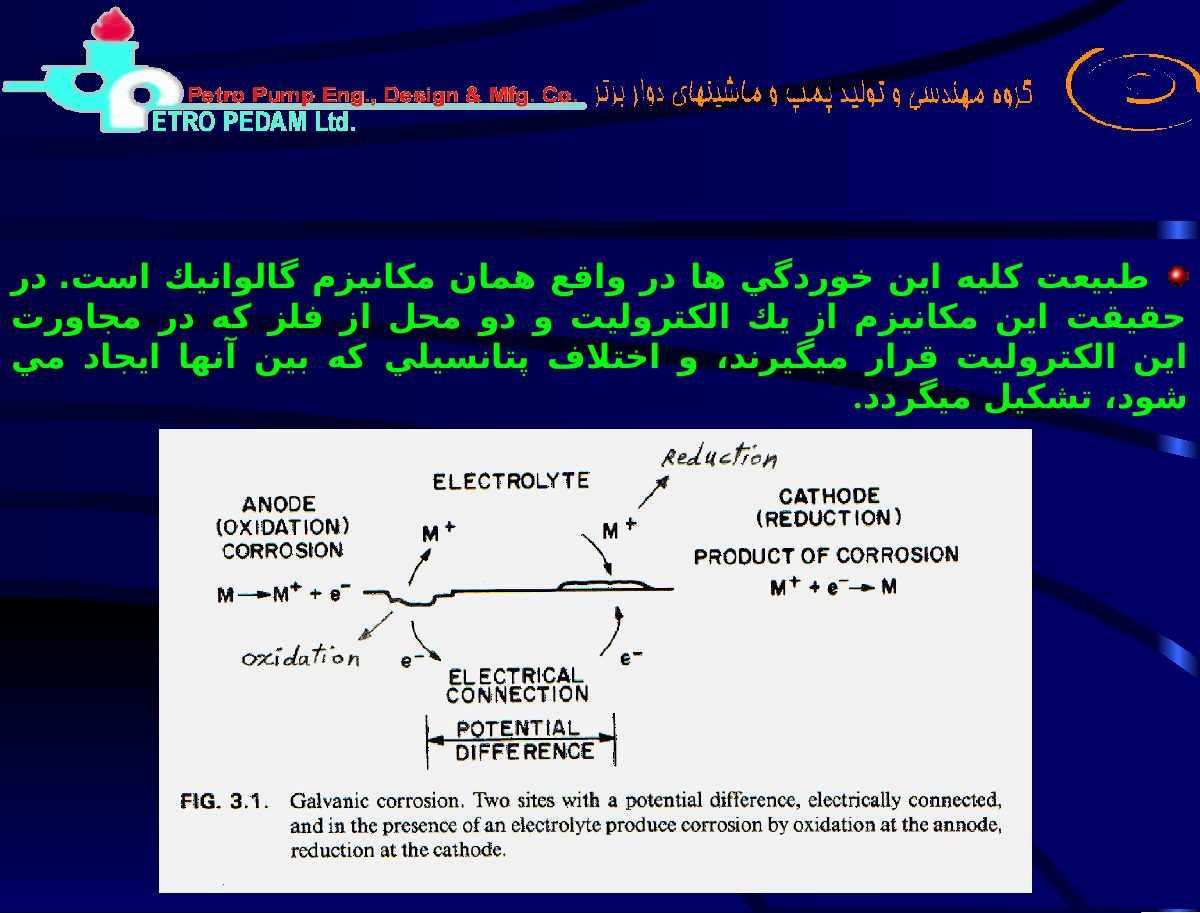
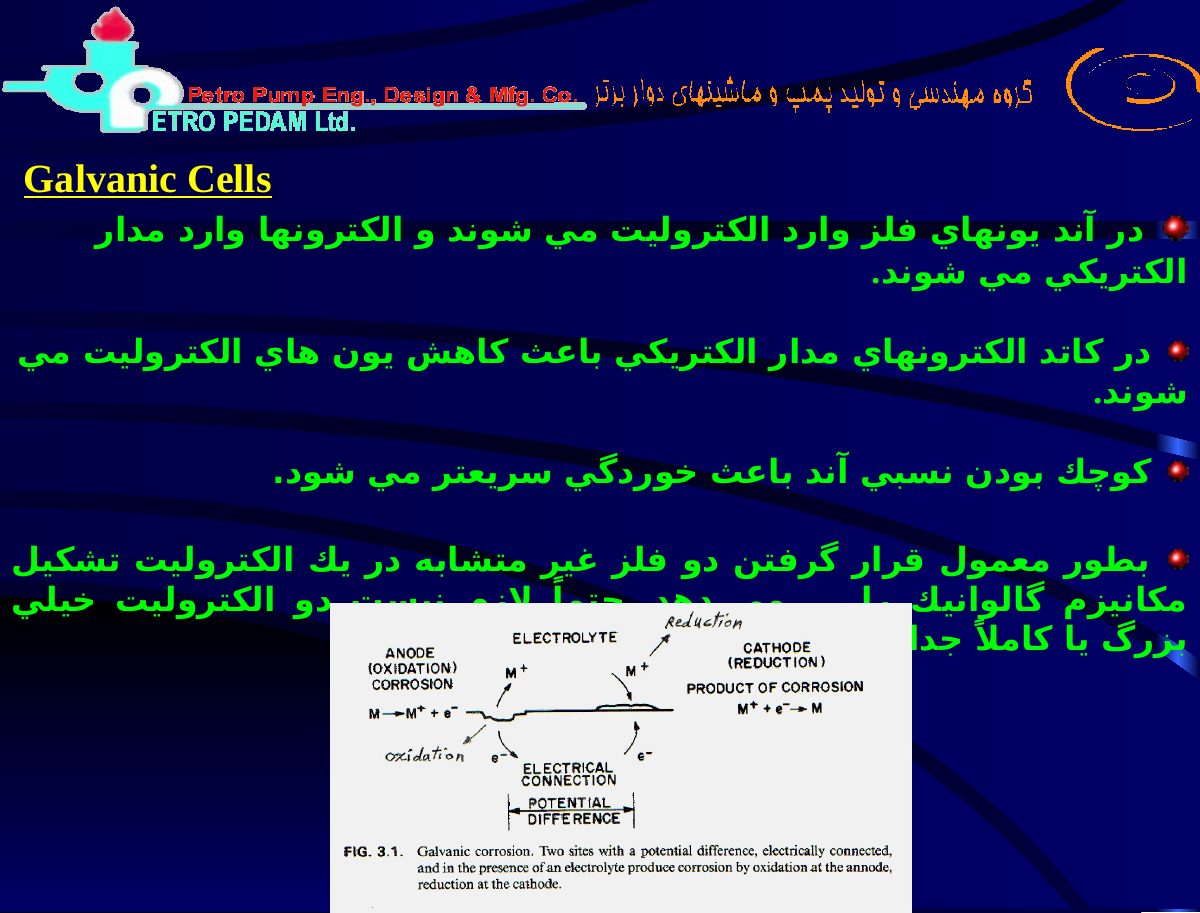
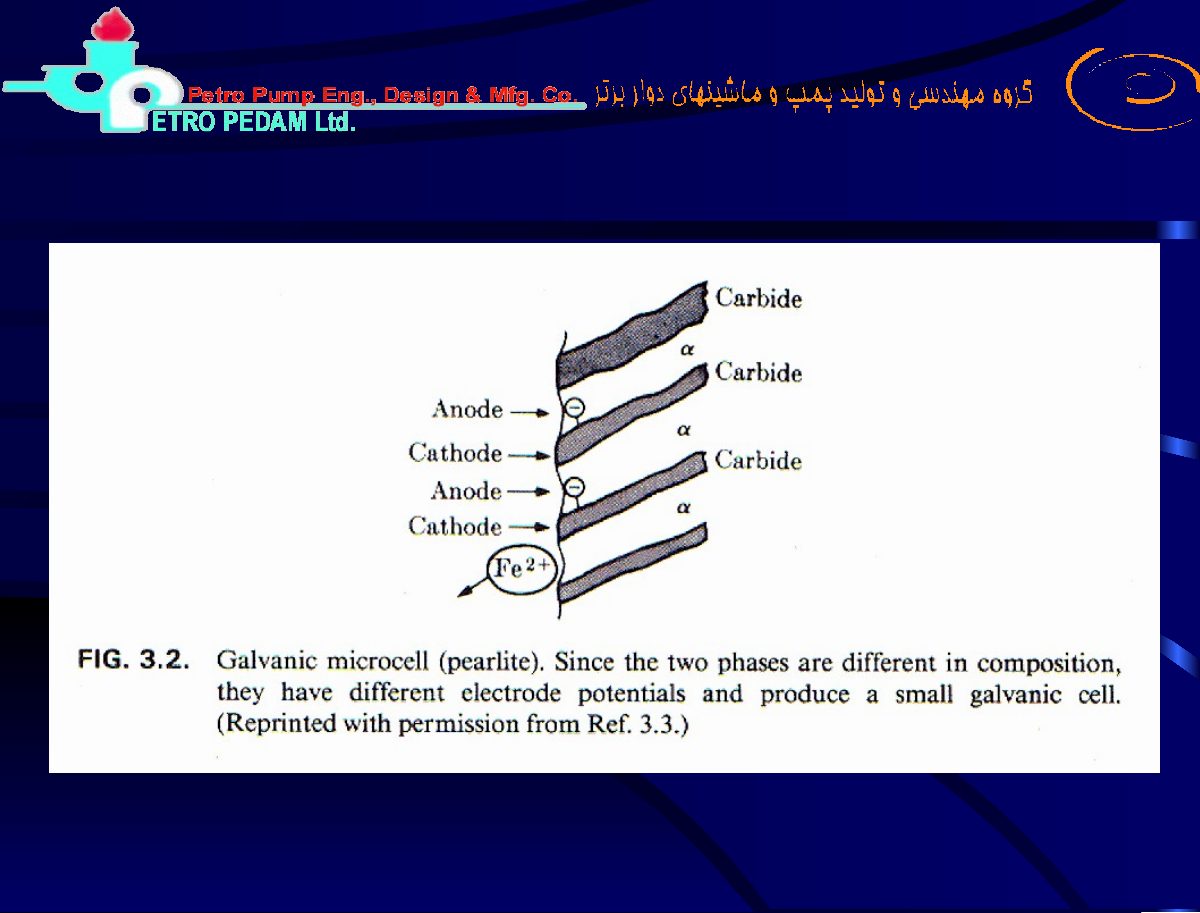
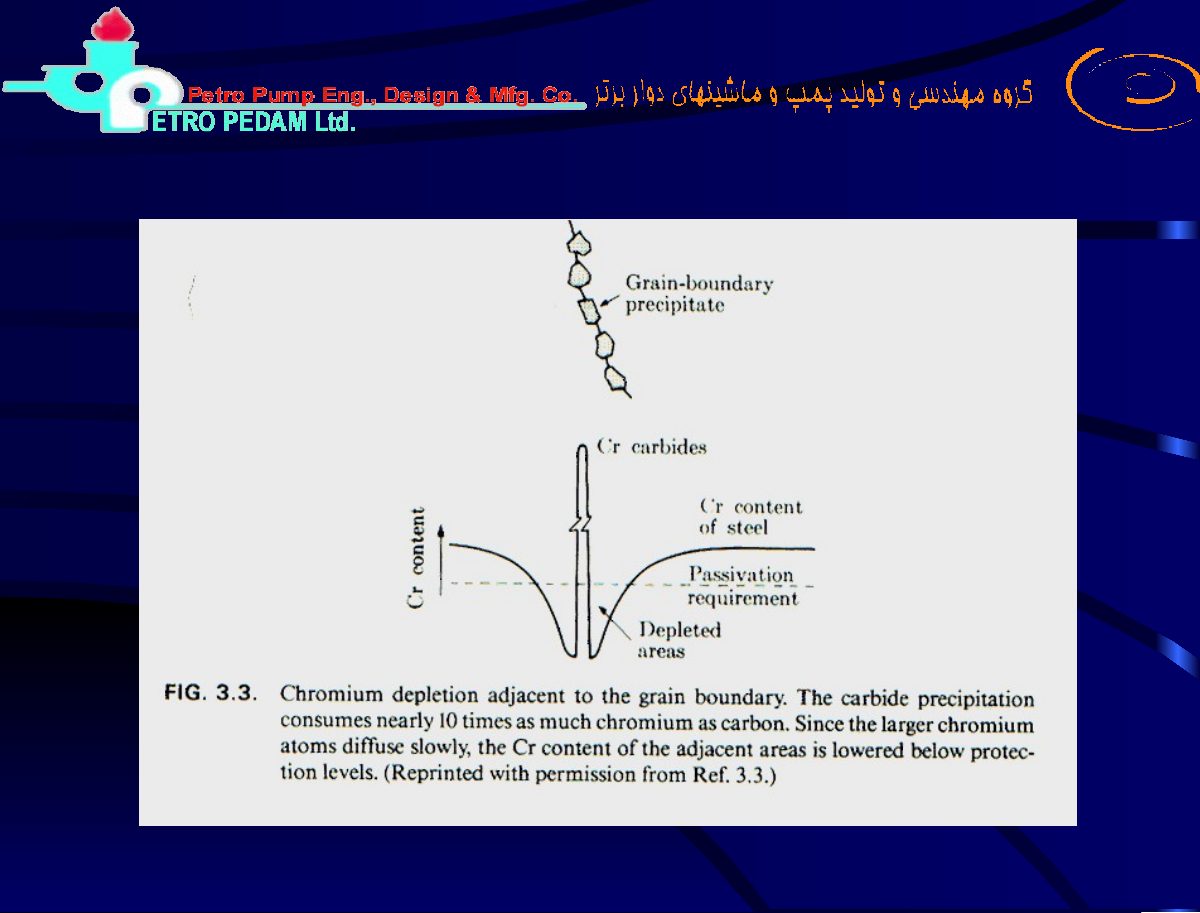
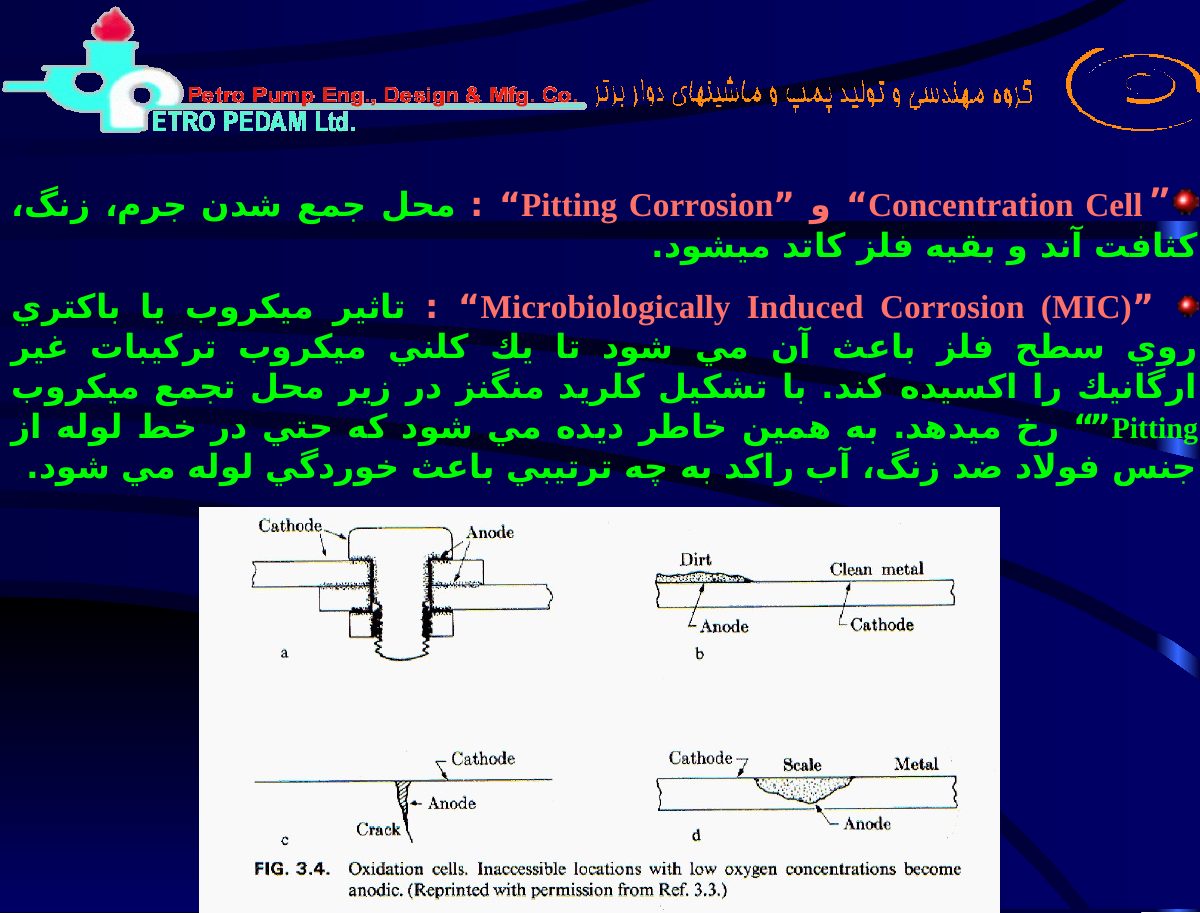

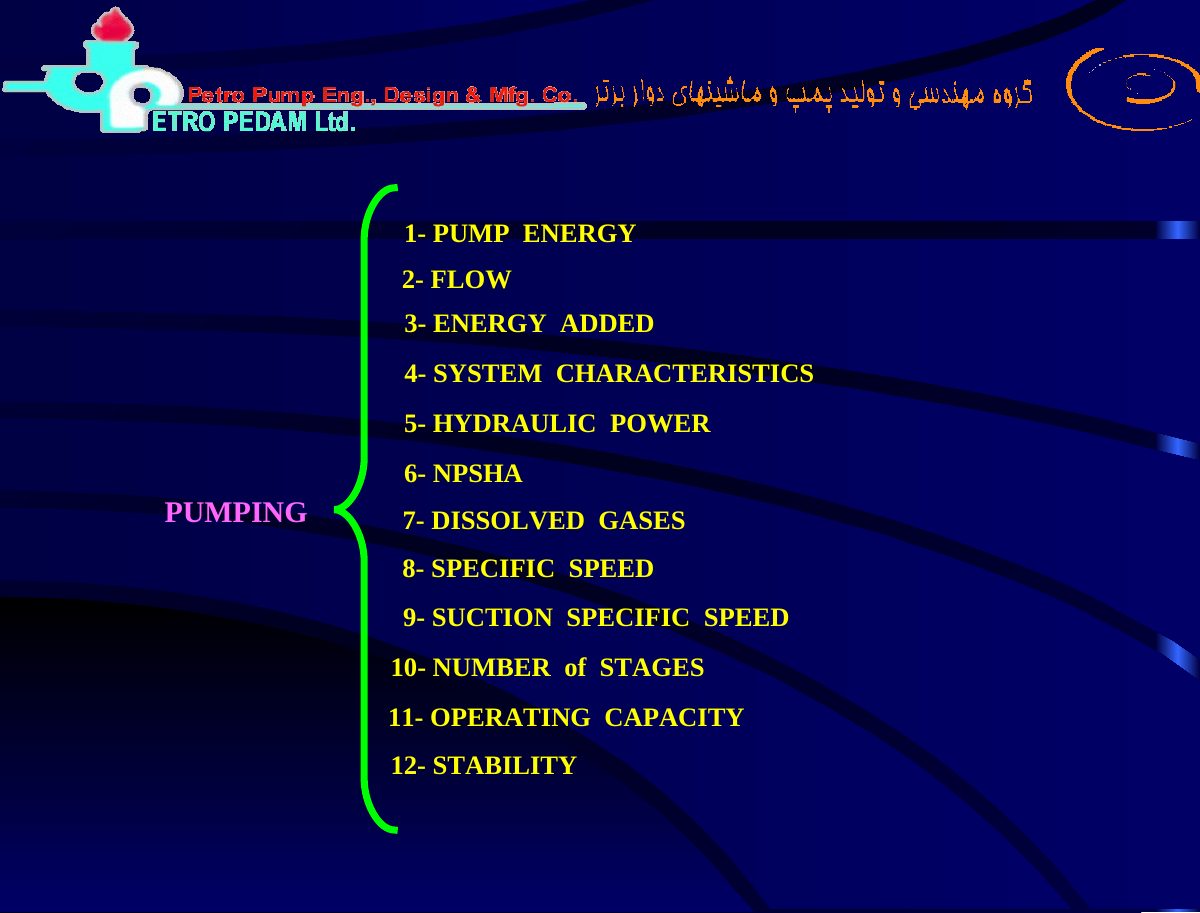
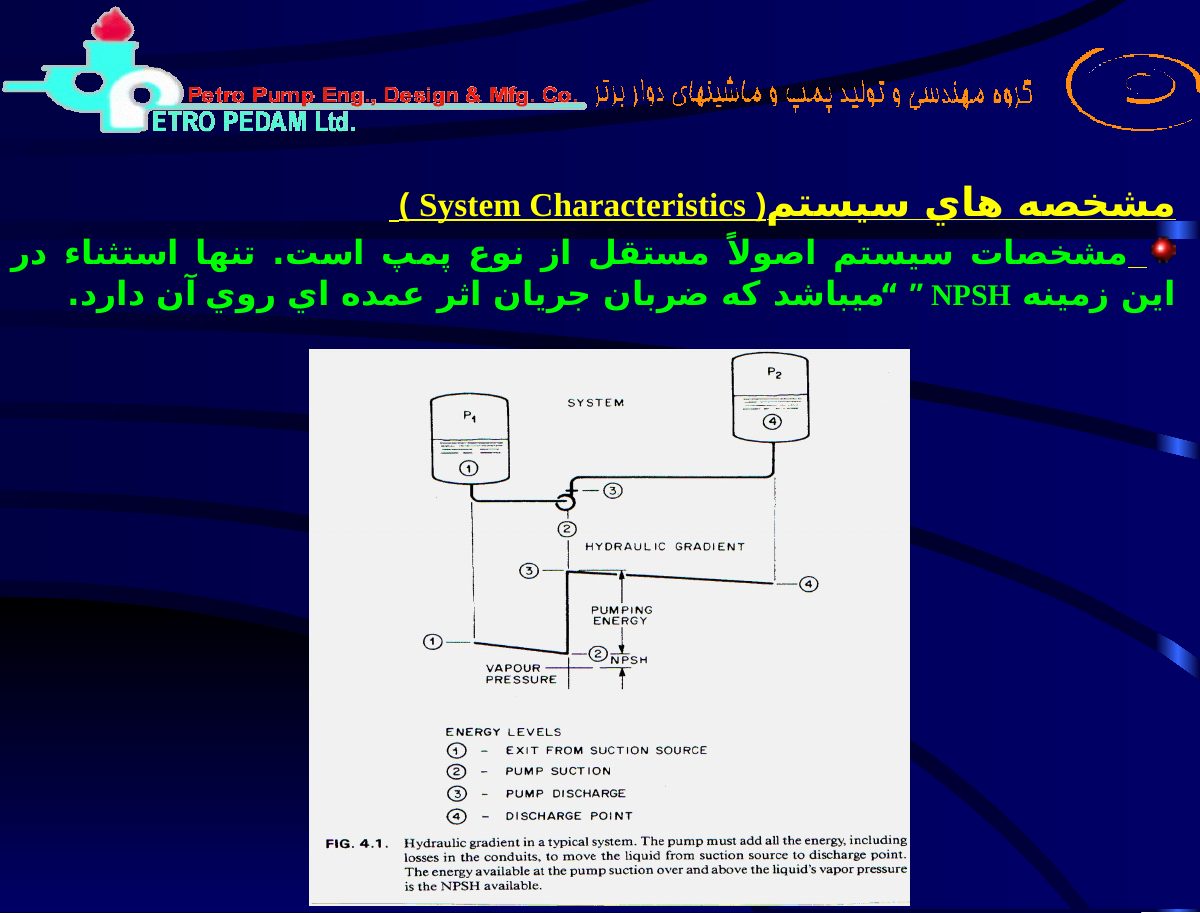
Original pages 25–36
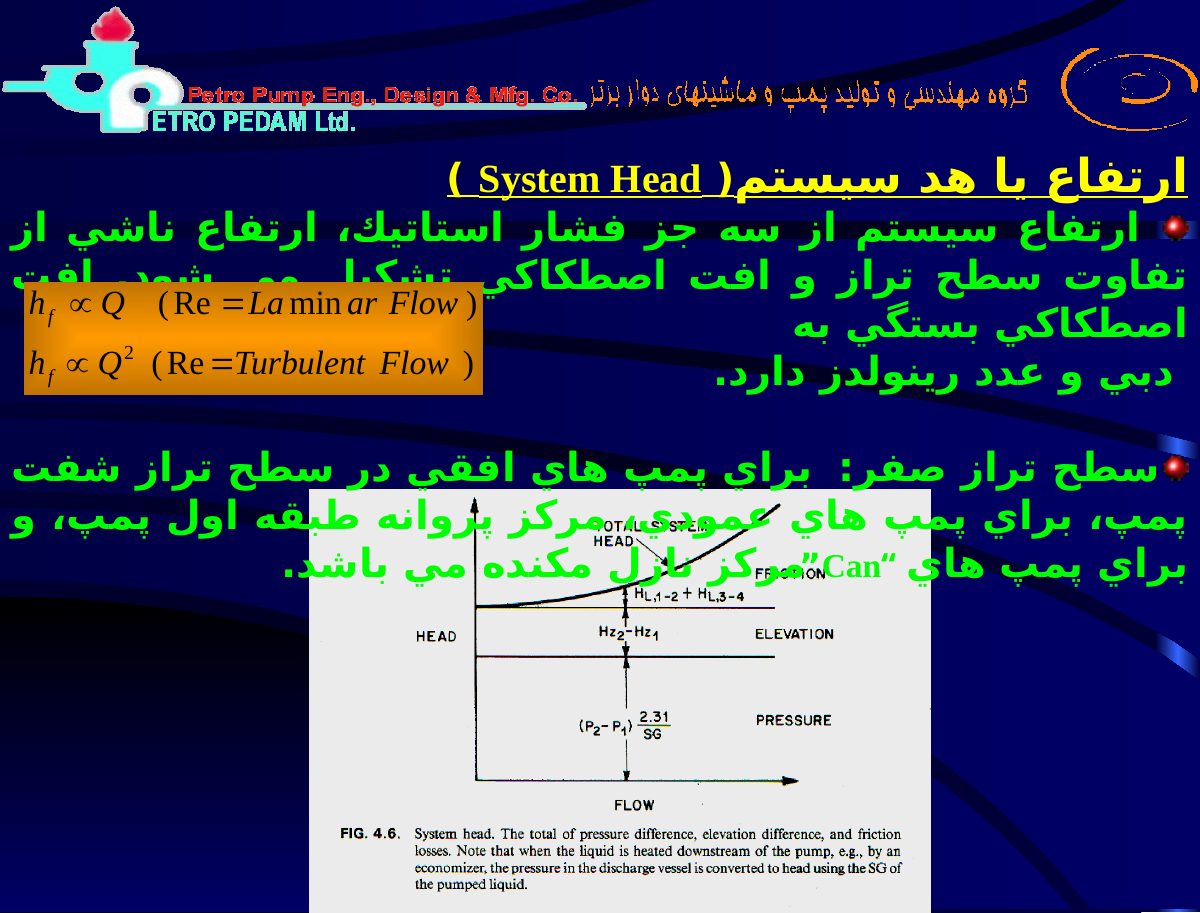
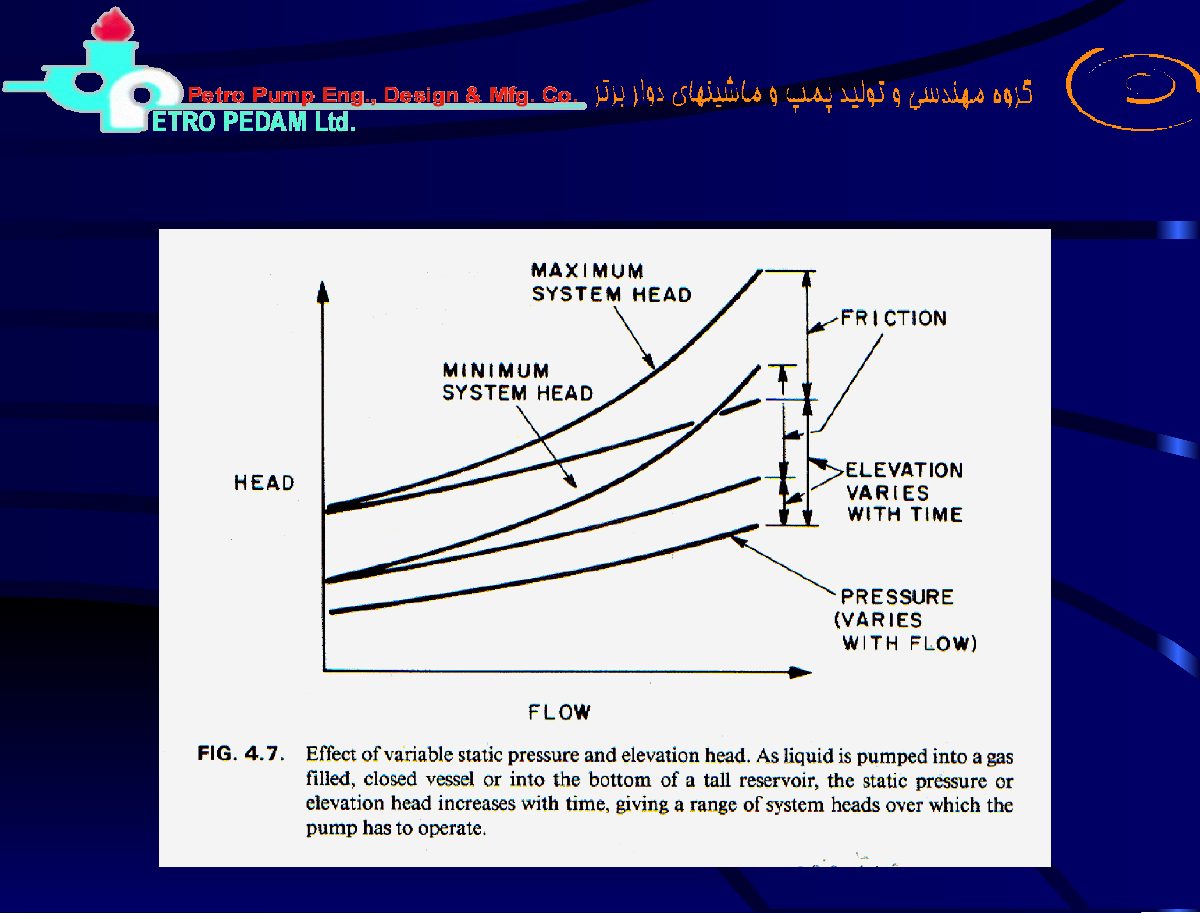
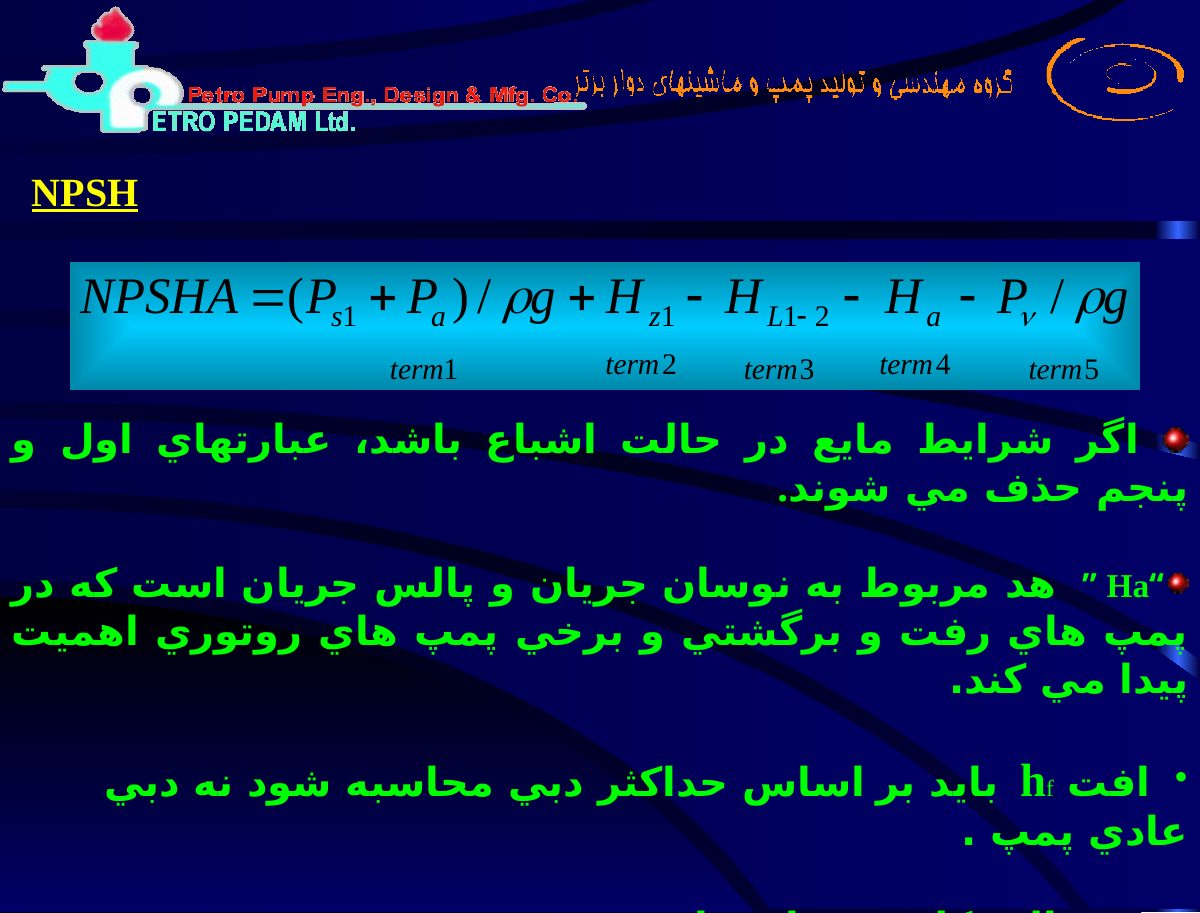
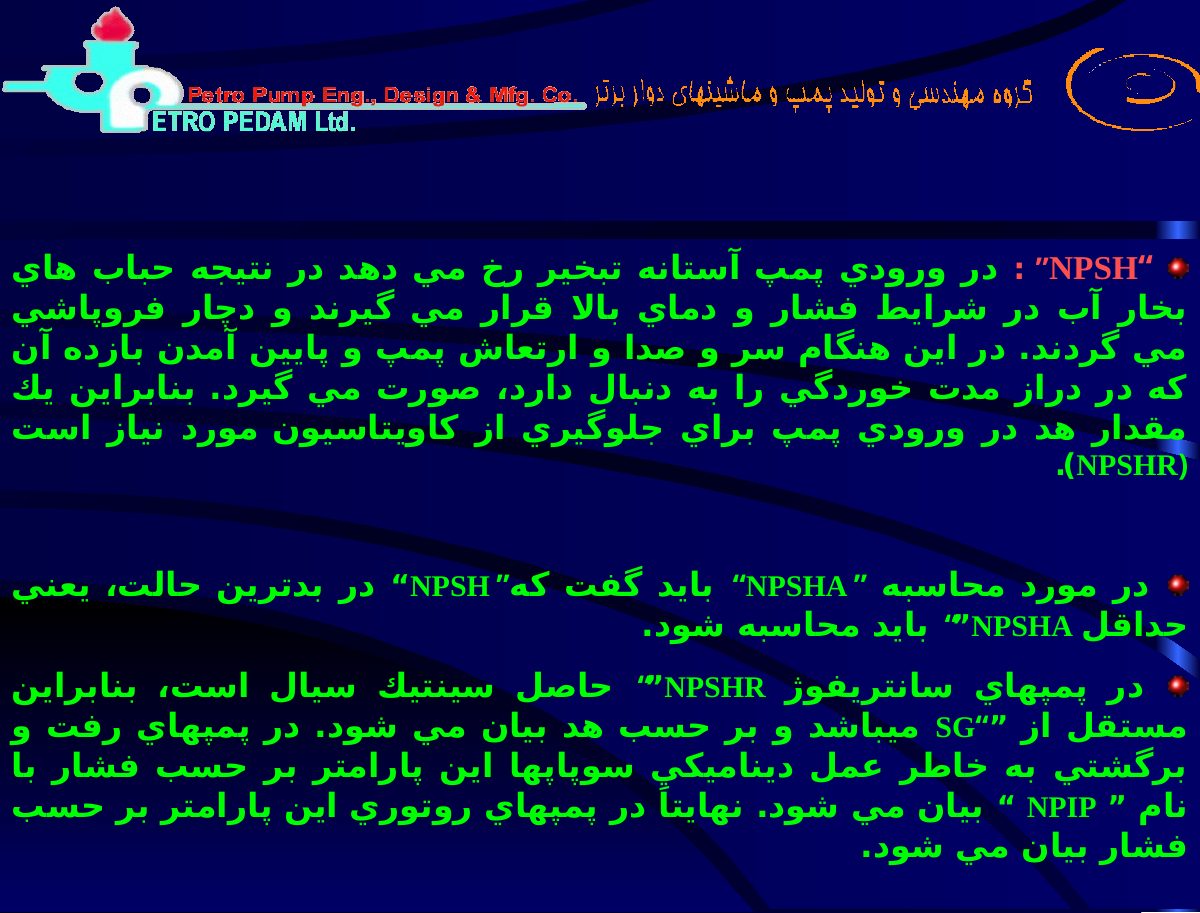
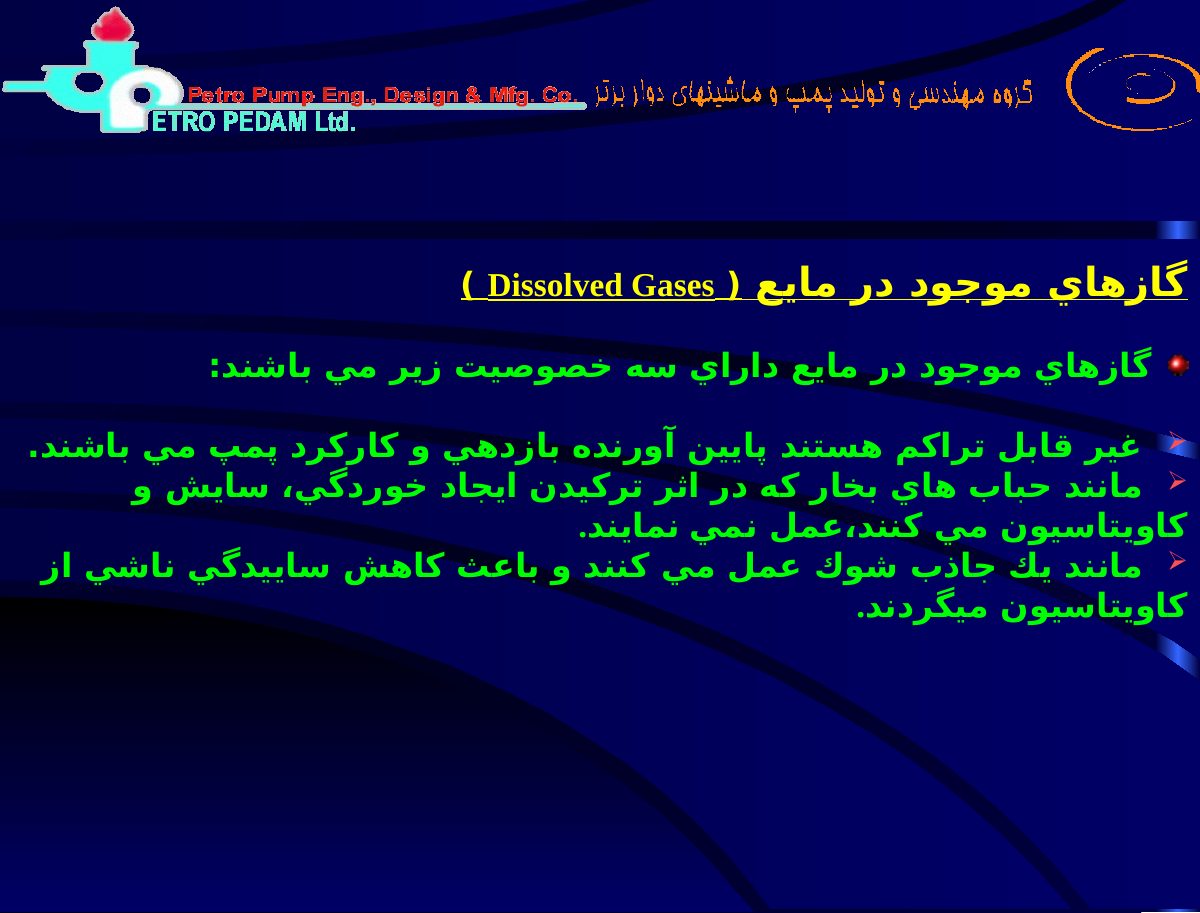
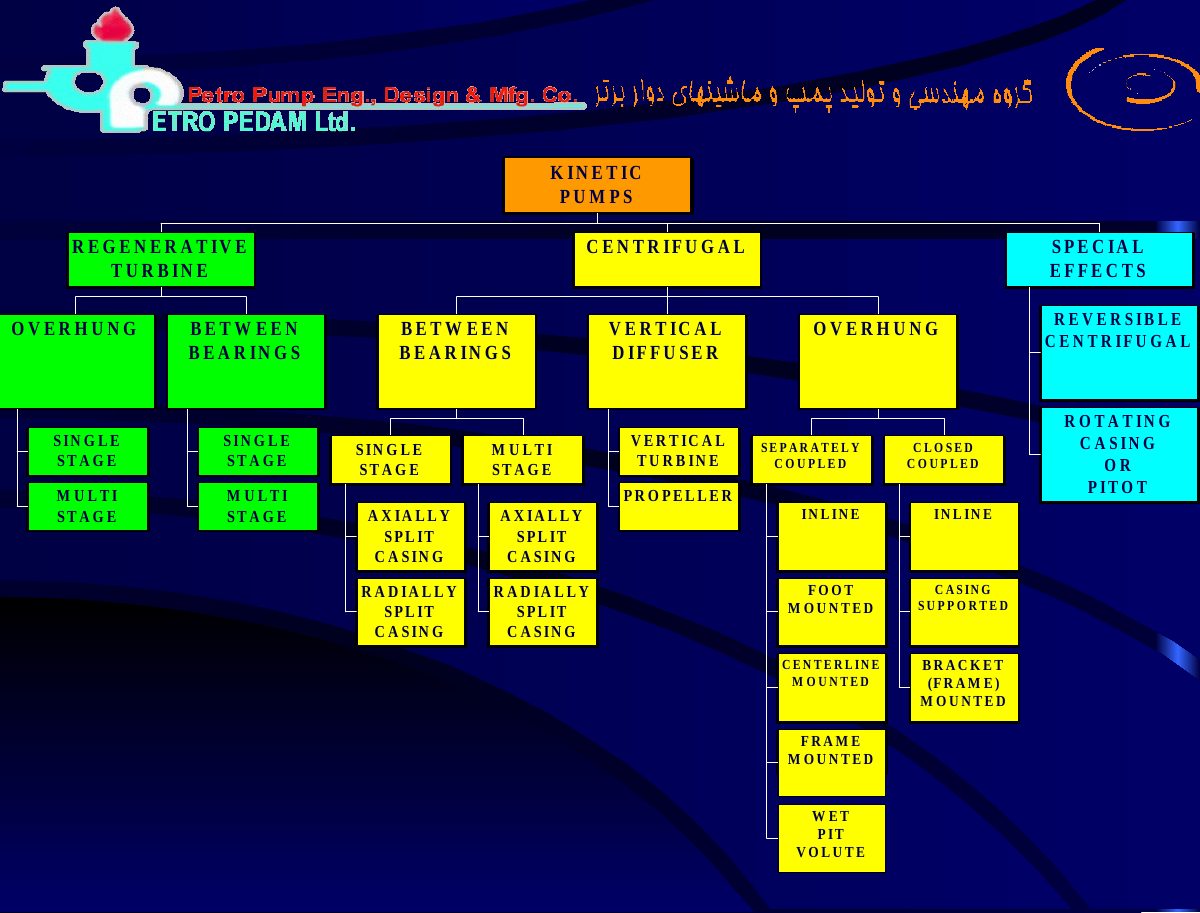
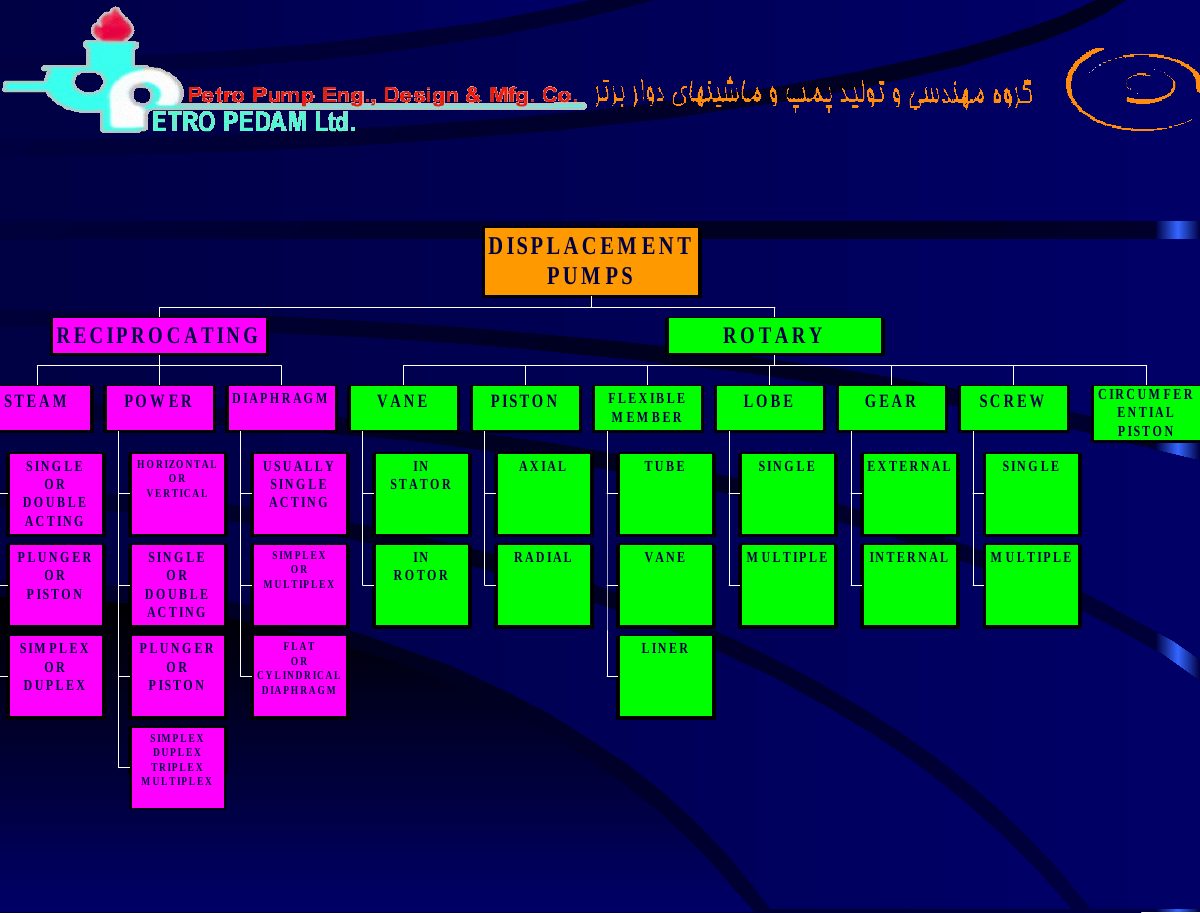
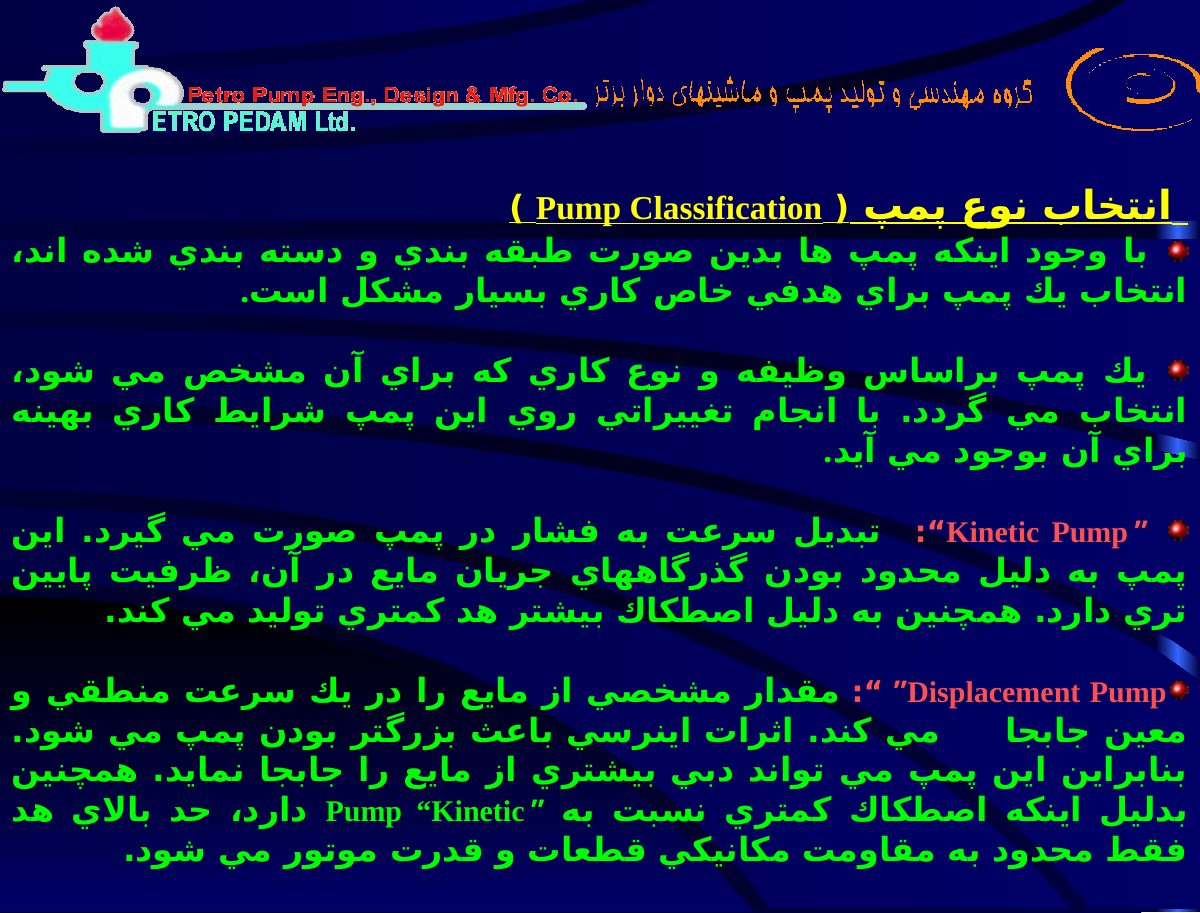
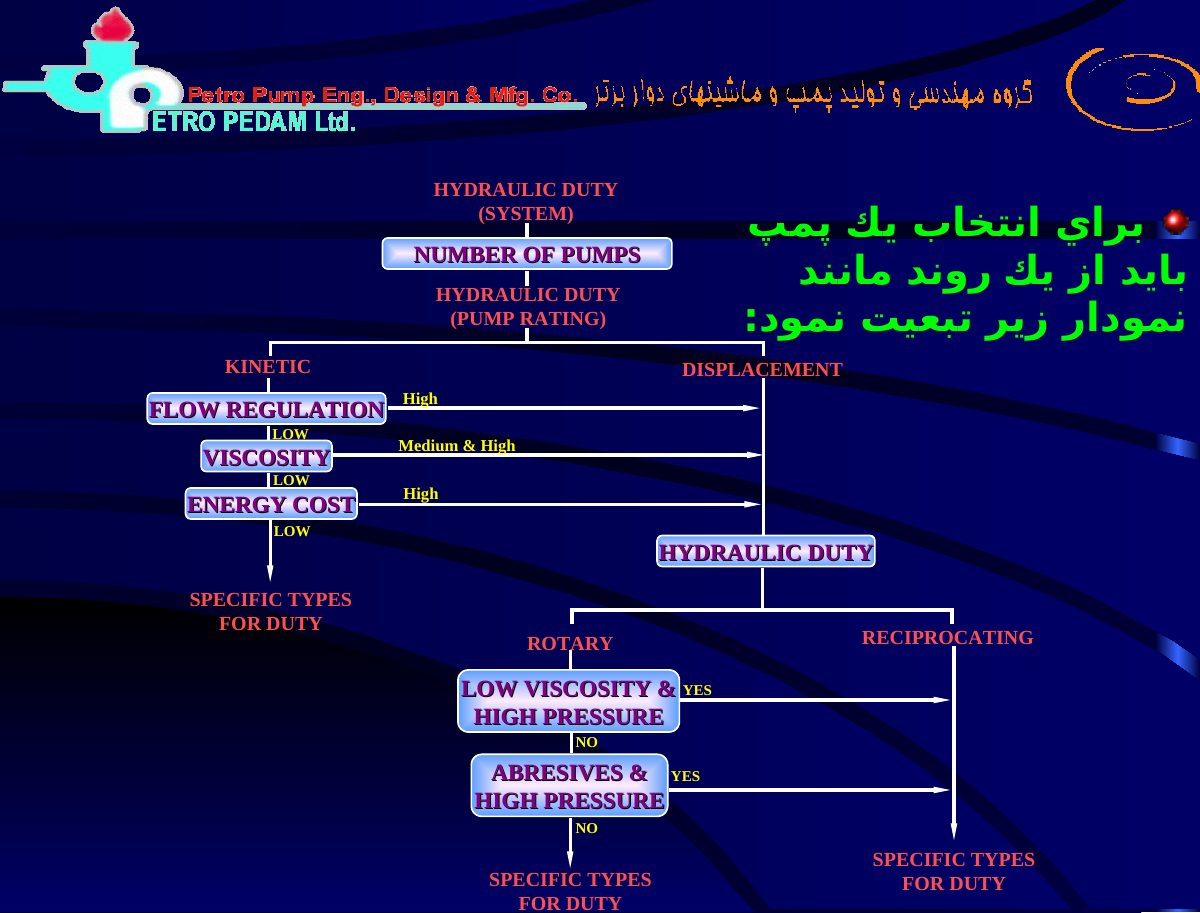
Original pages 37–48
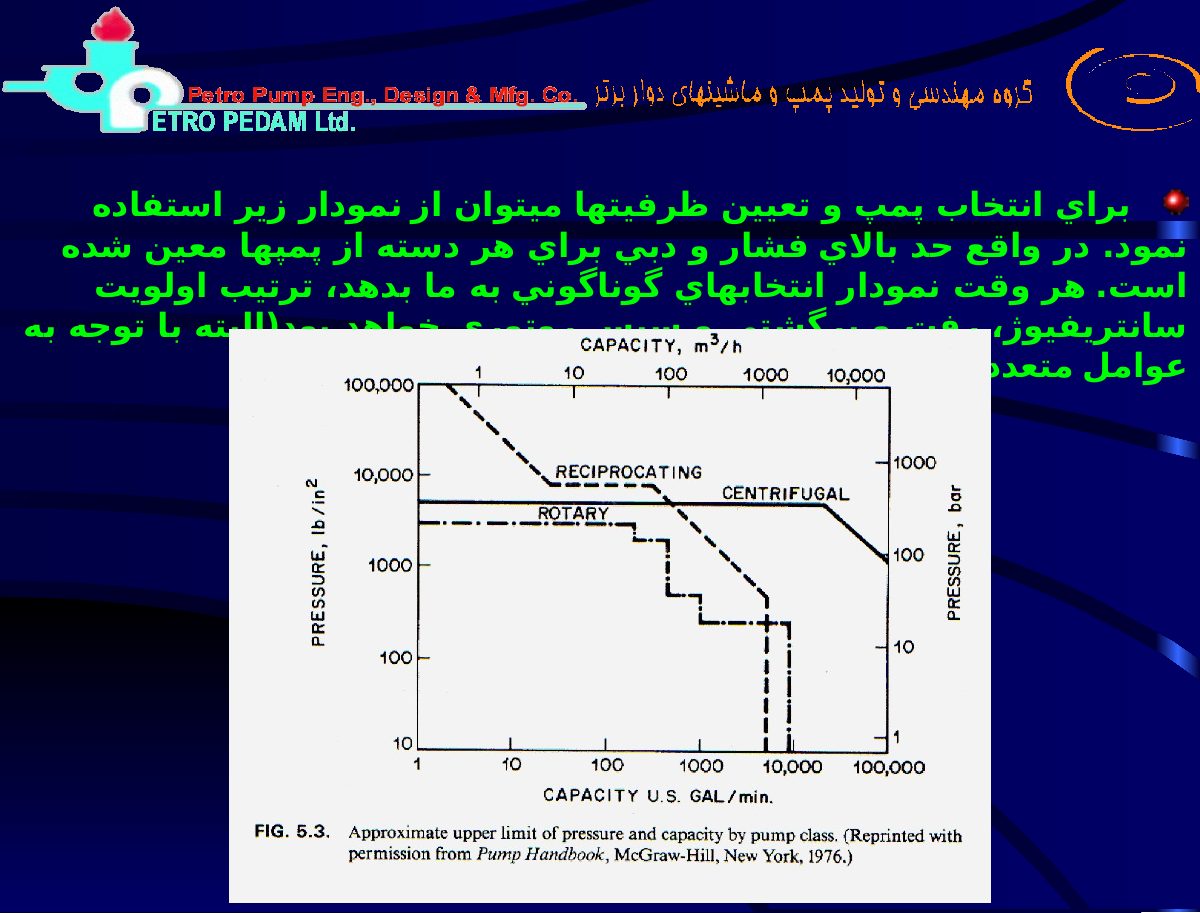
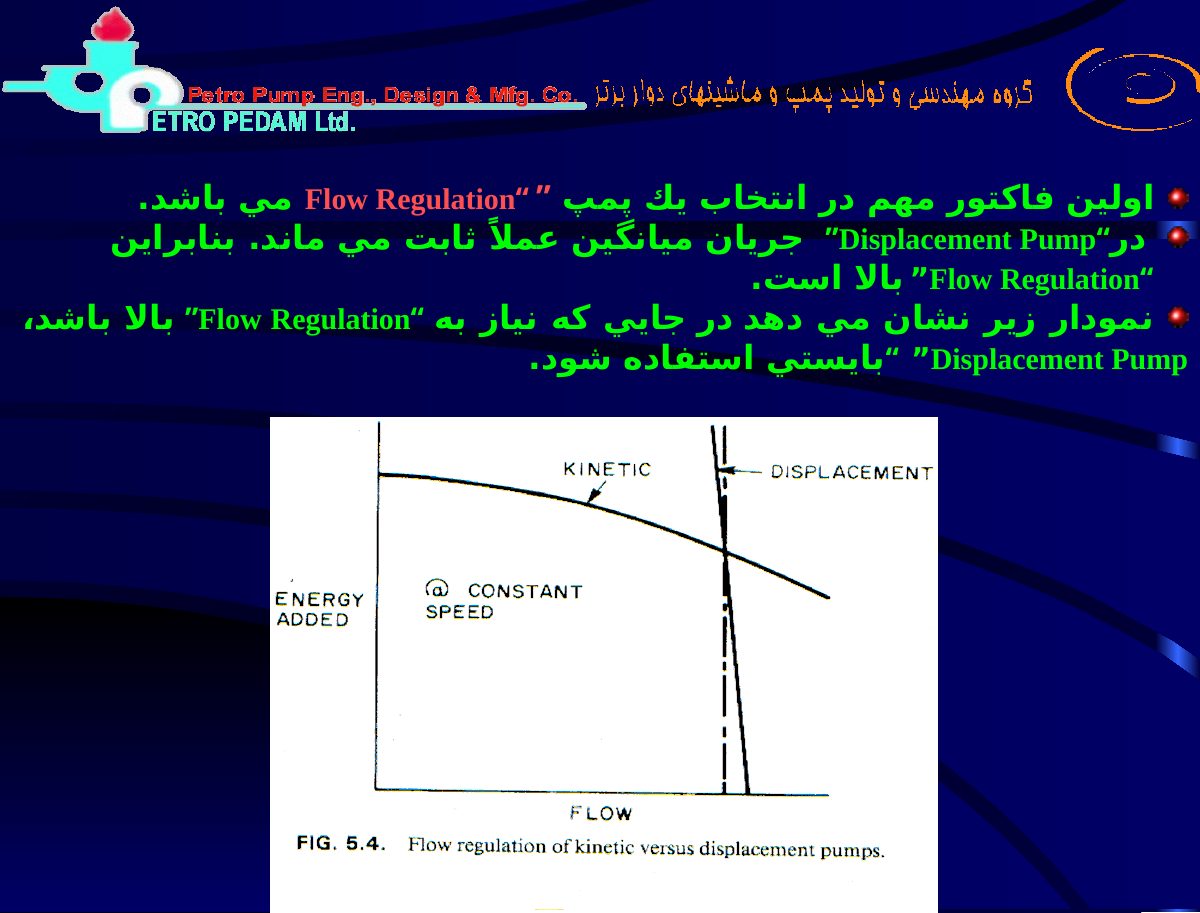
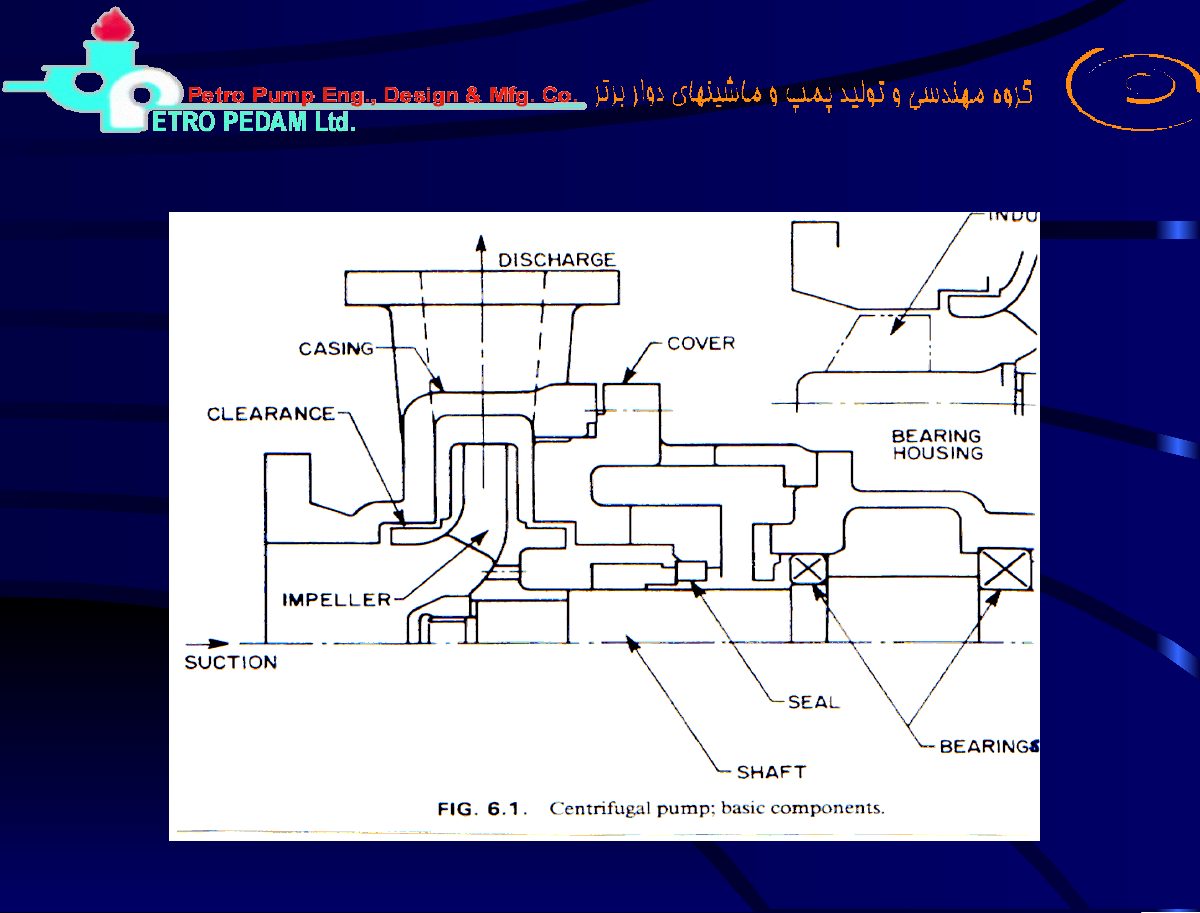
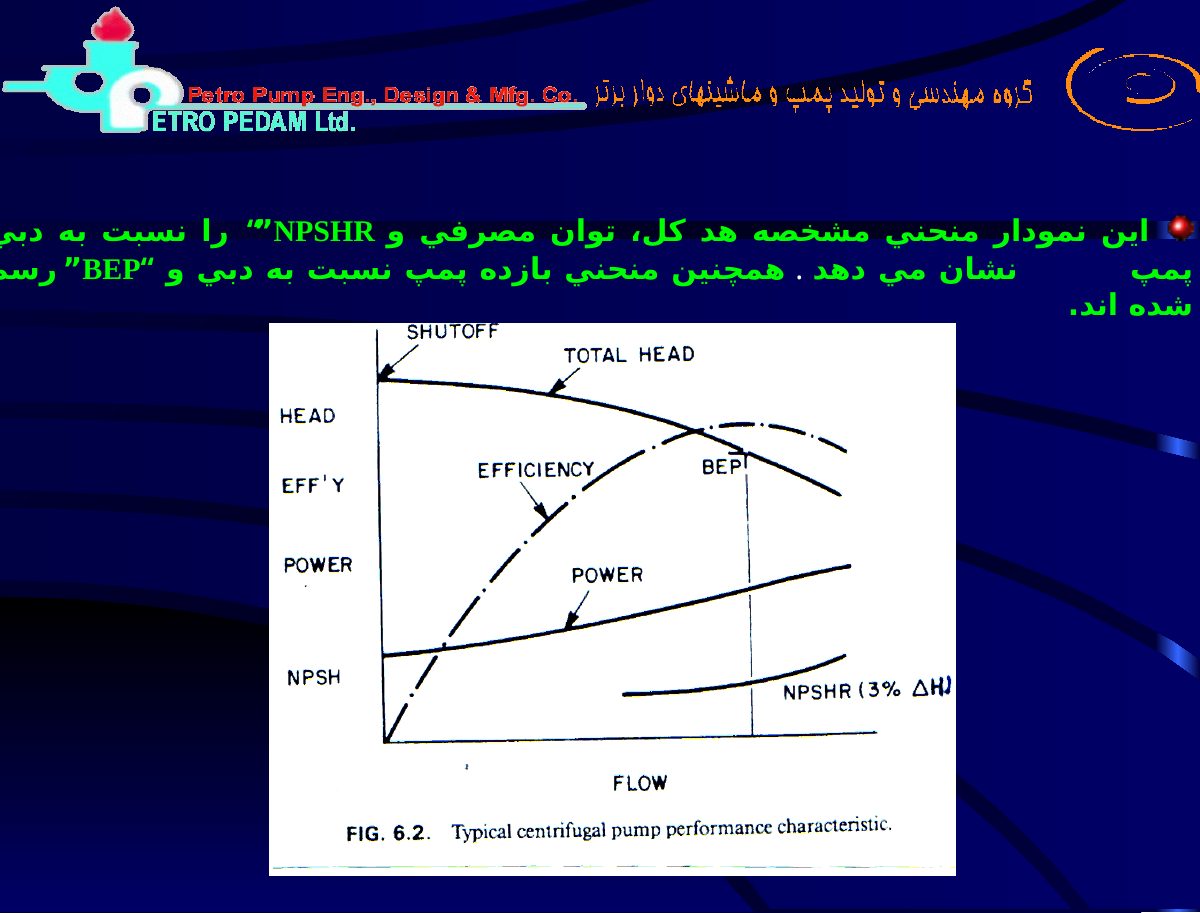
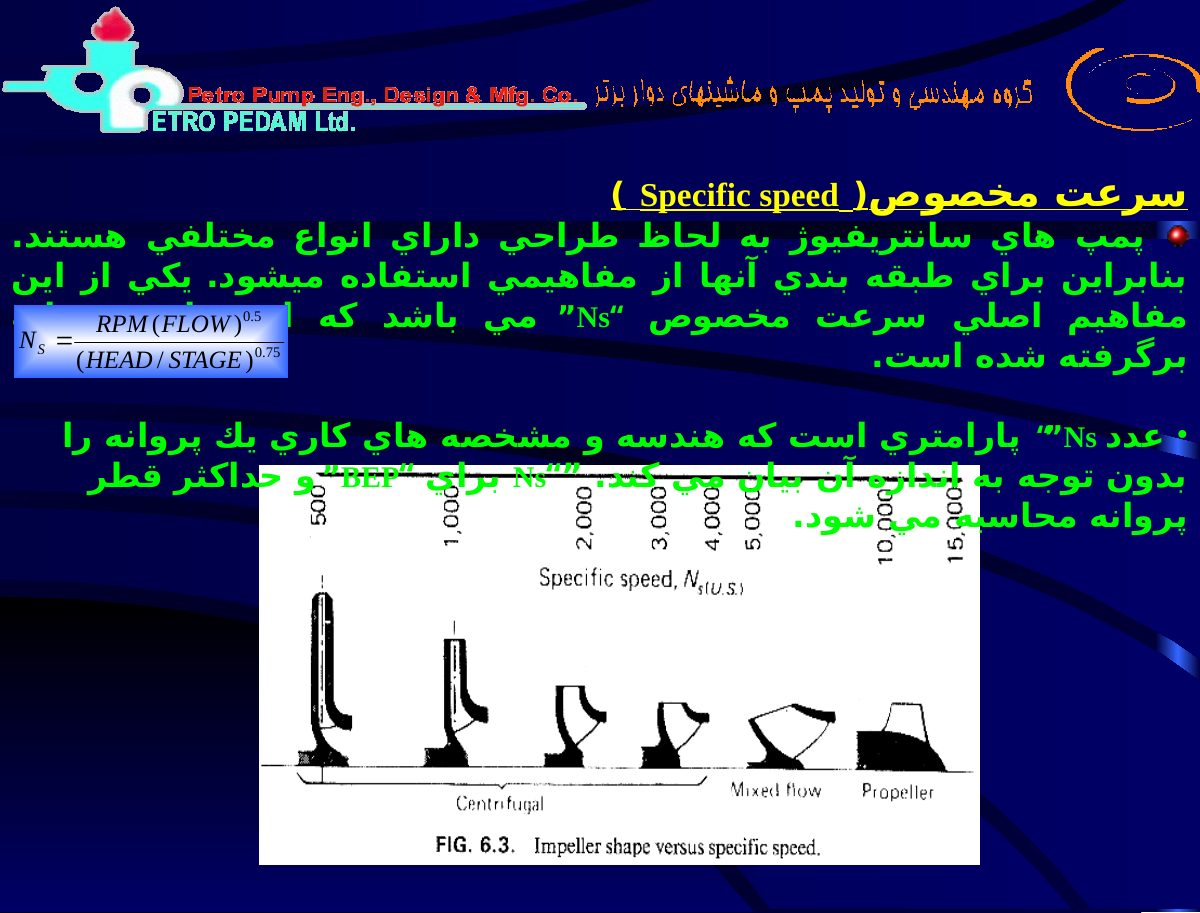
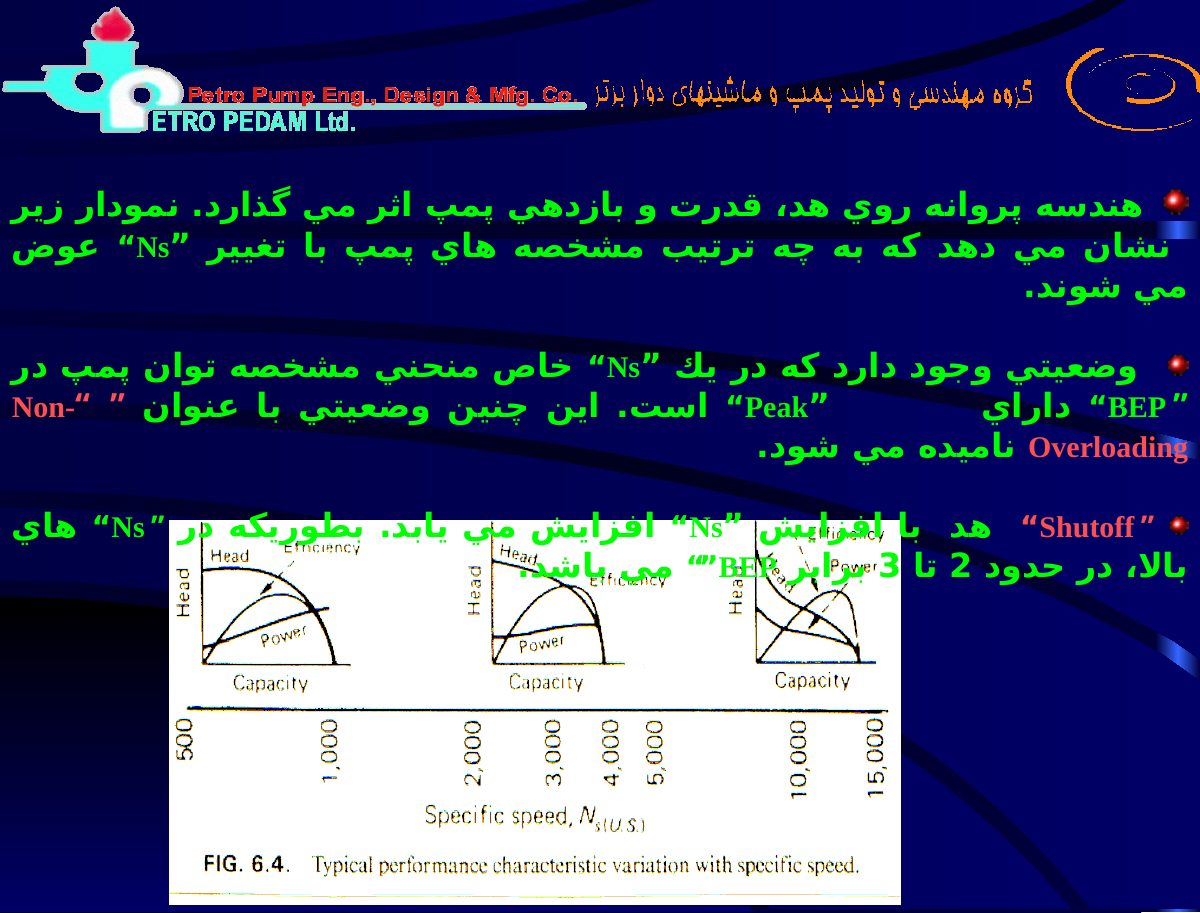
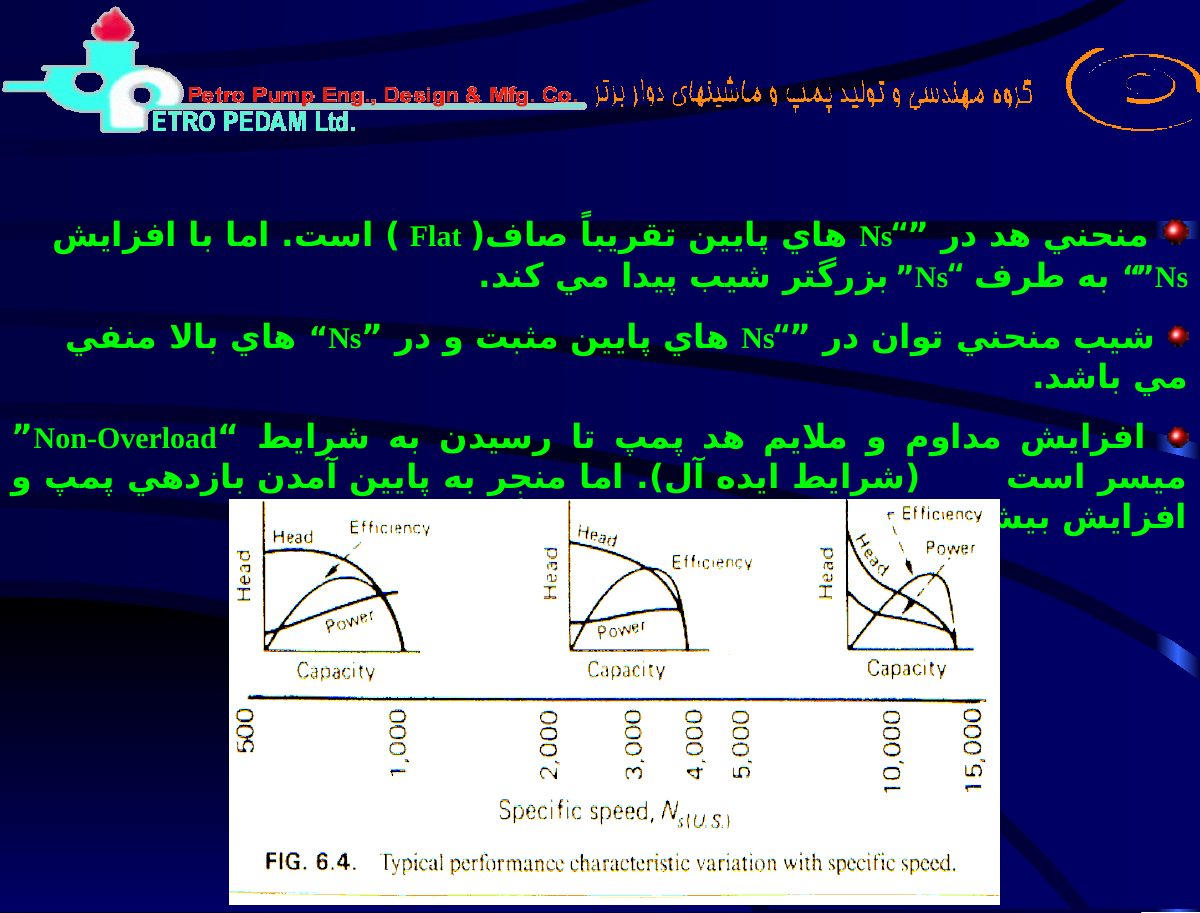
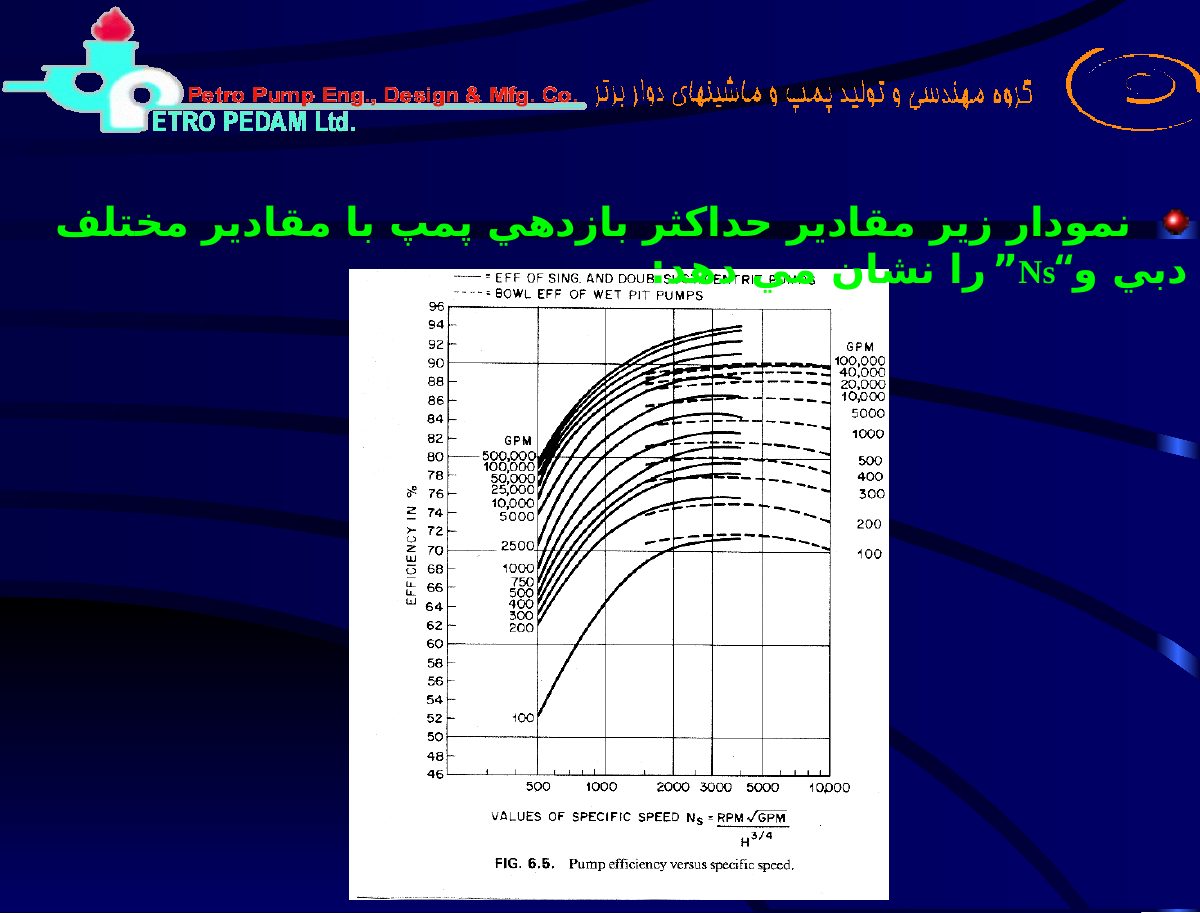
Original pages 49–60
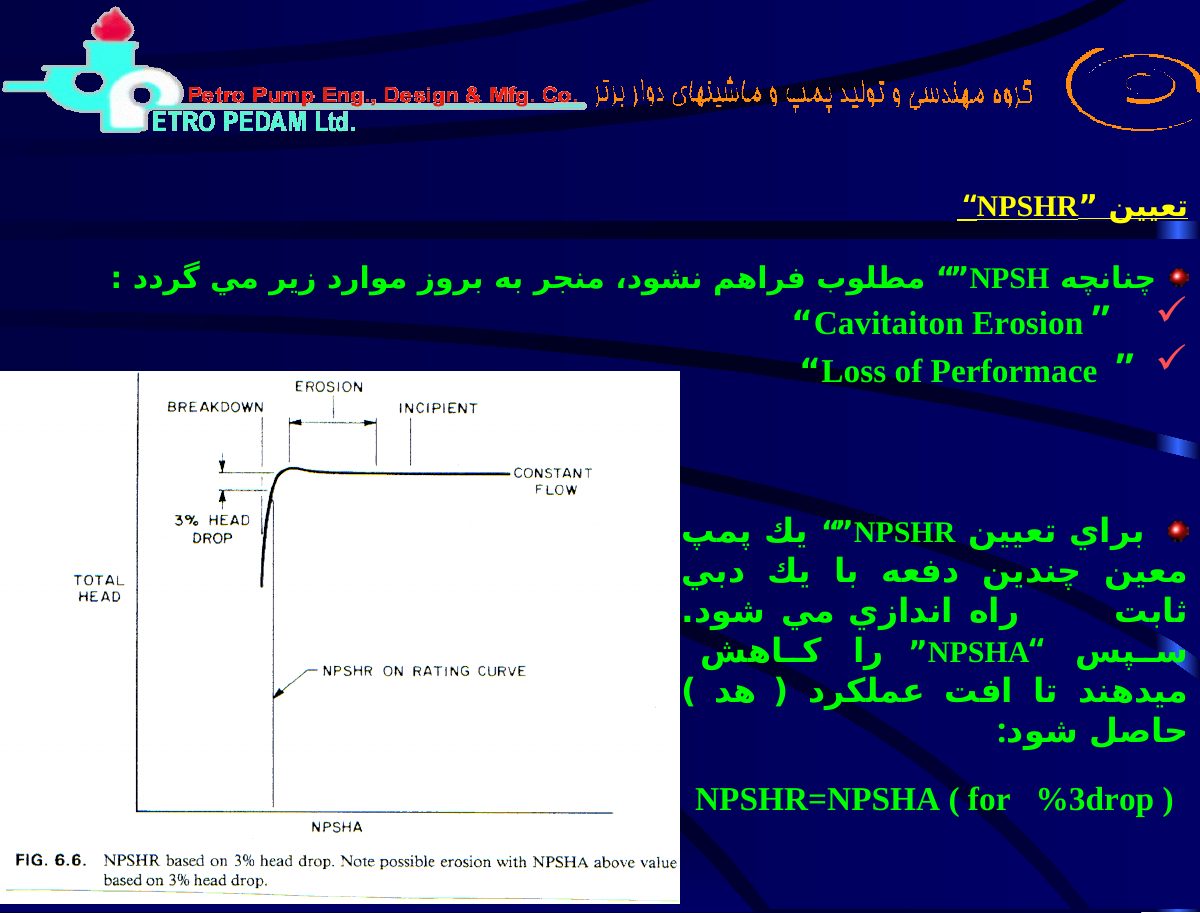
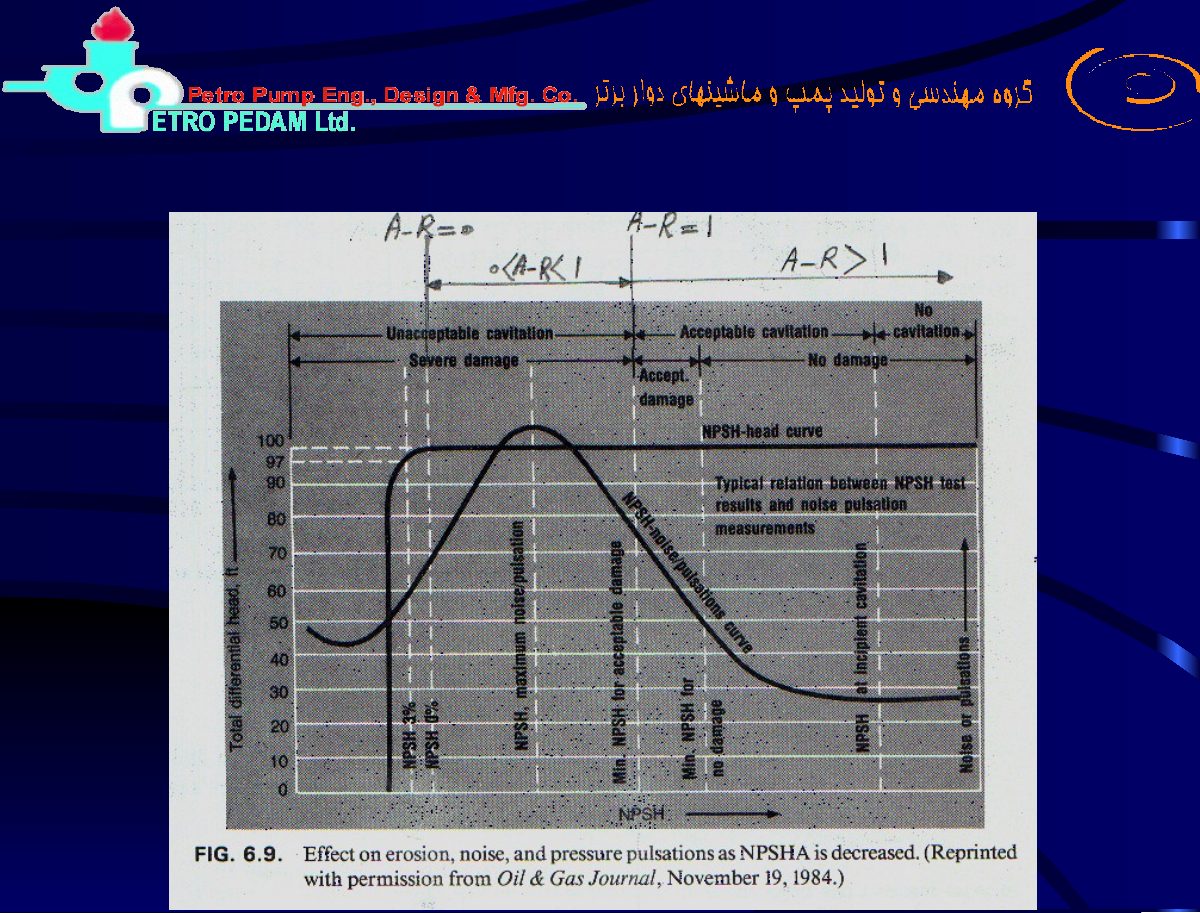
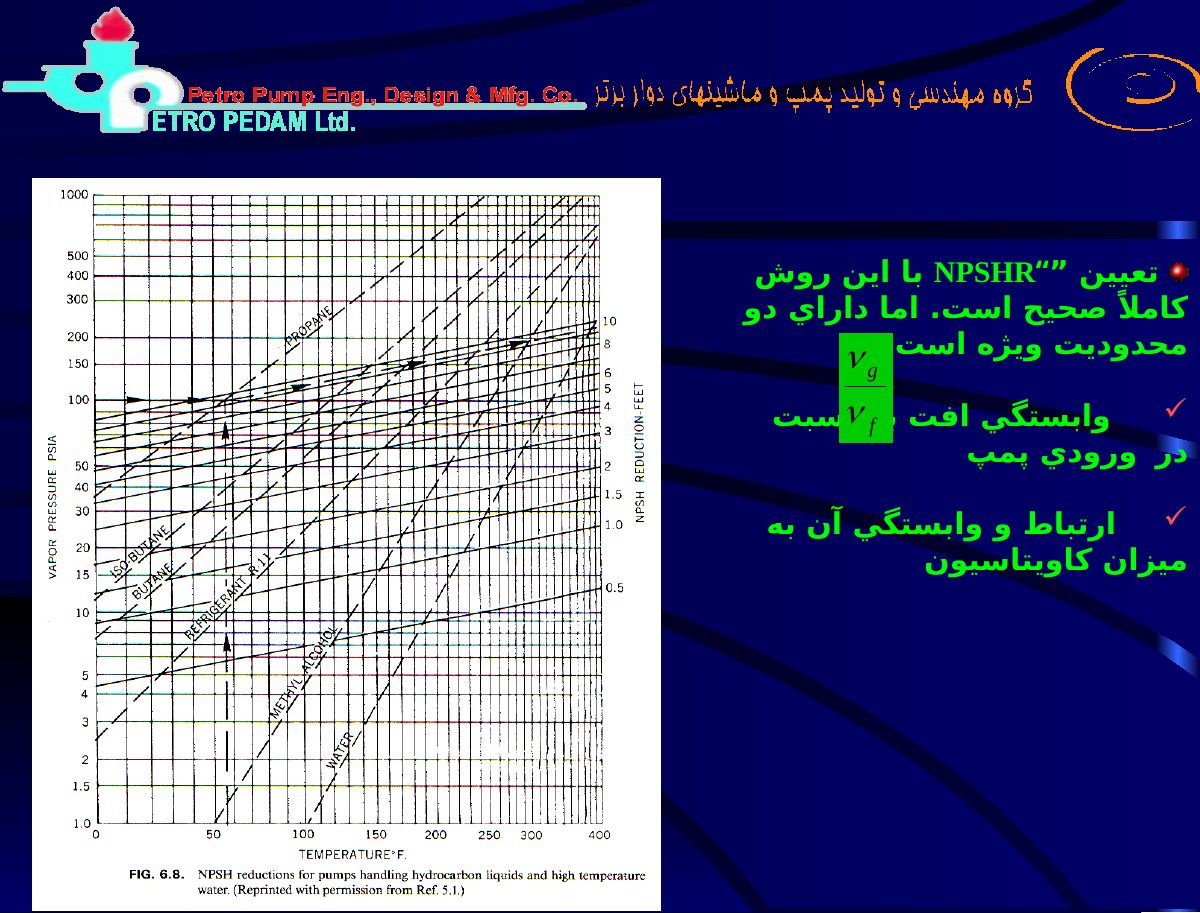
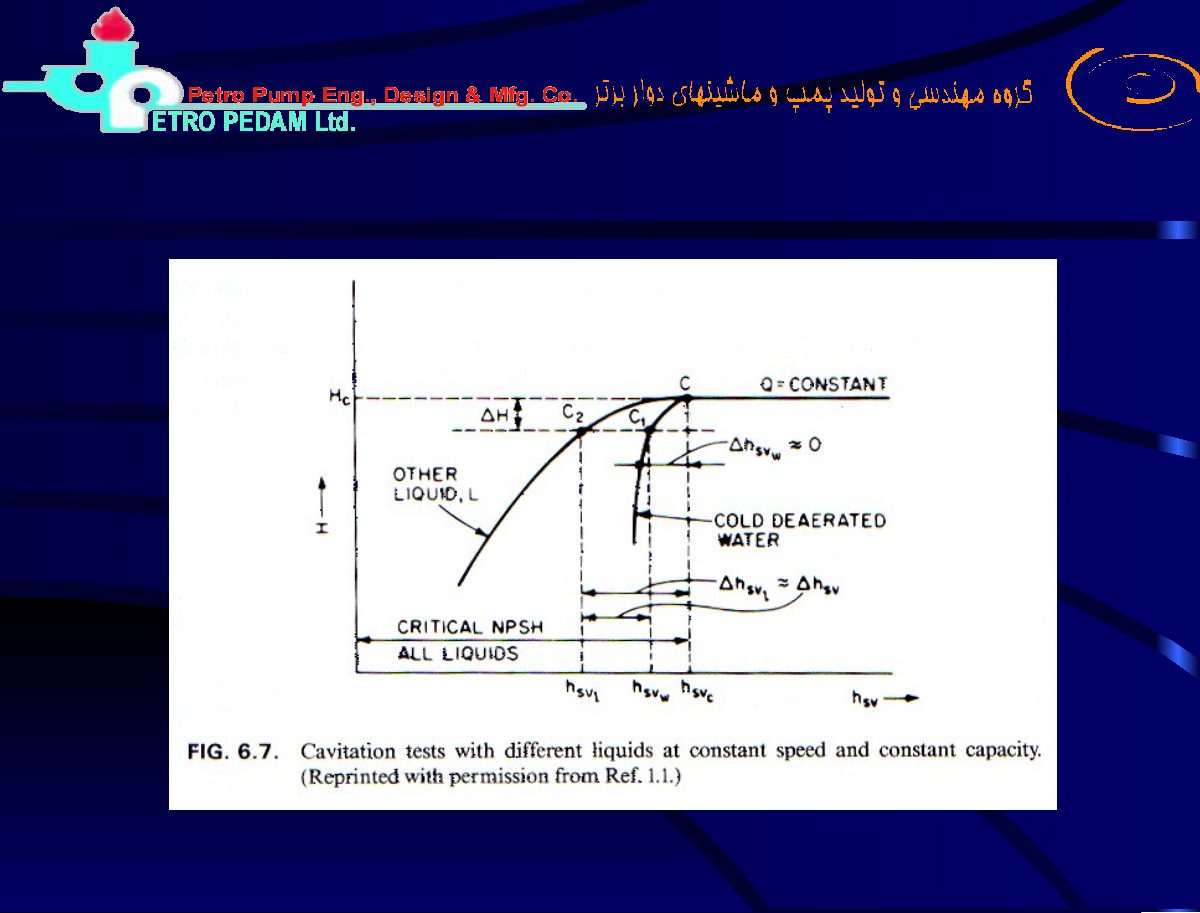
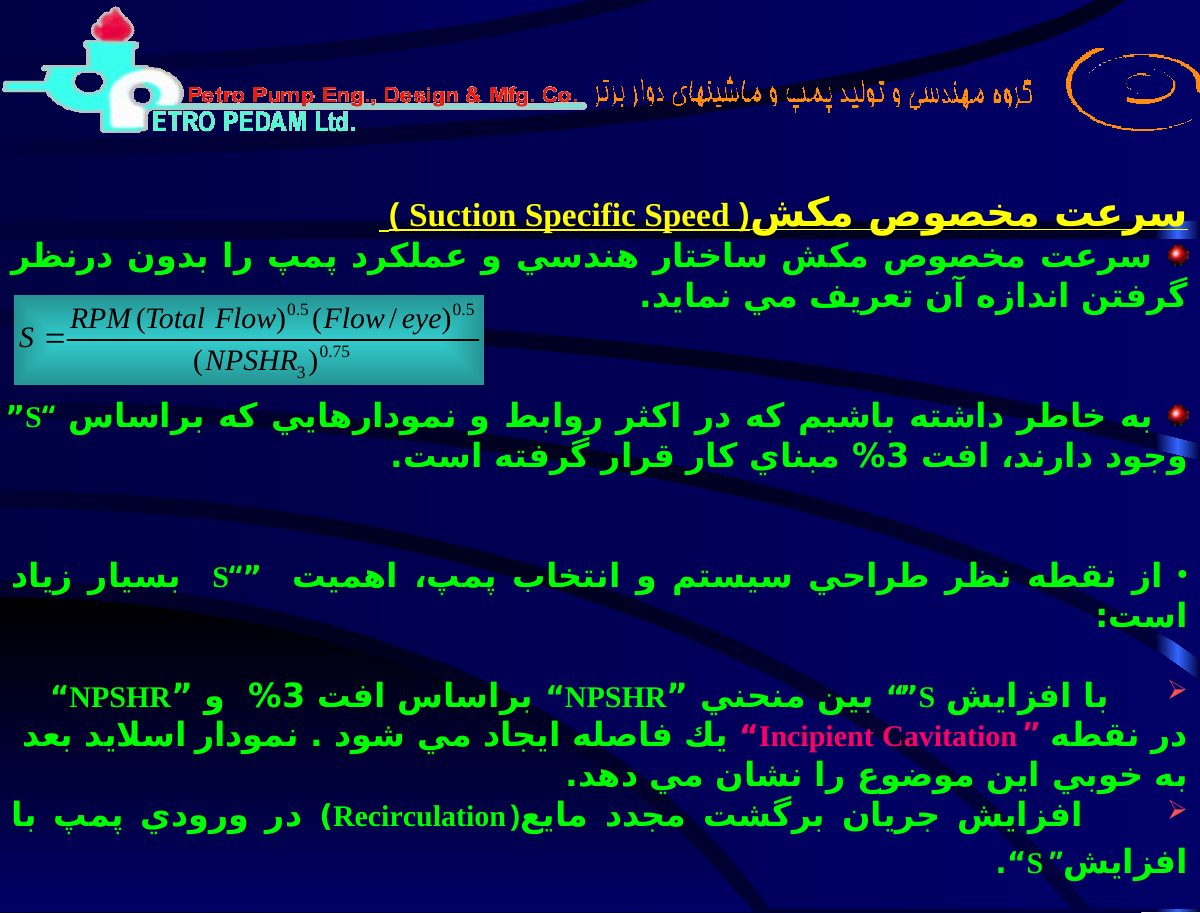
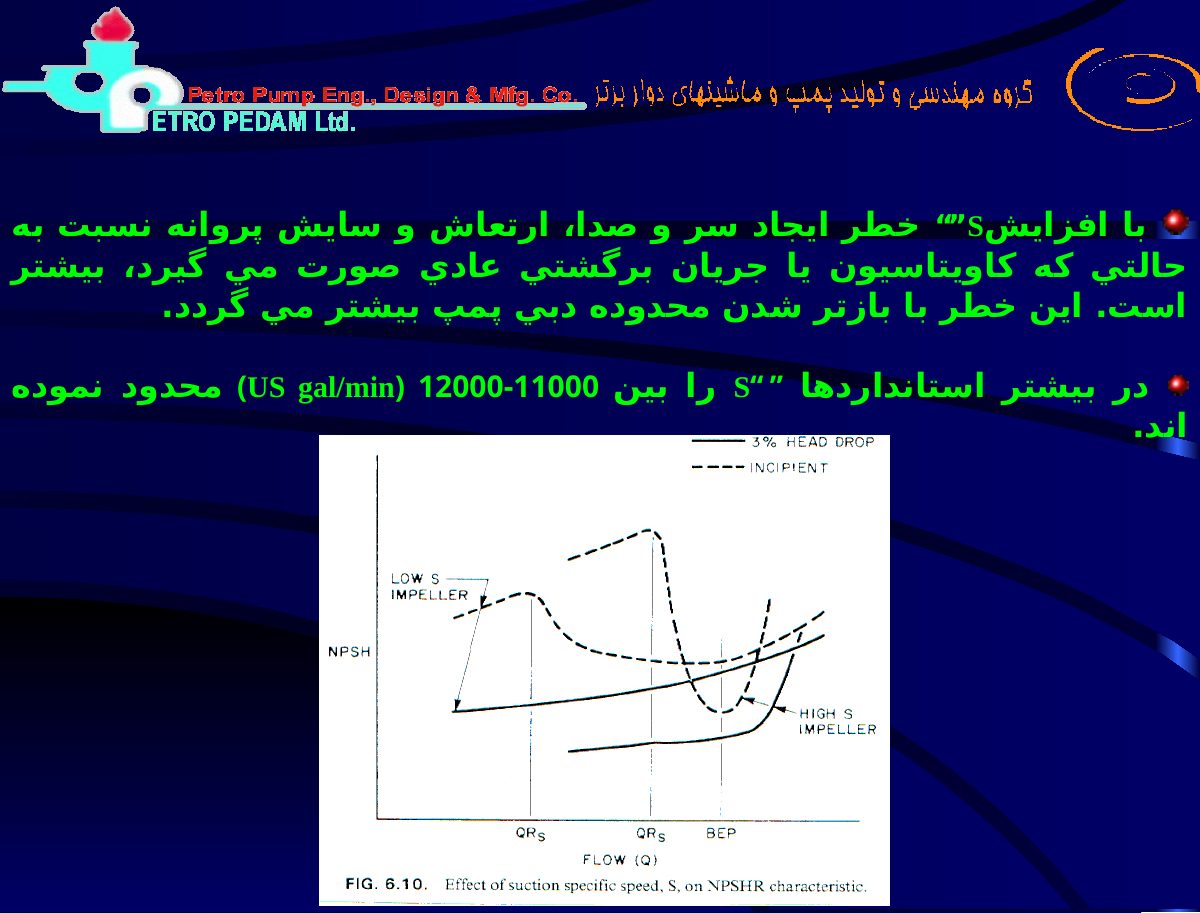
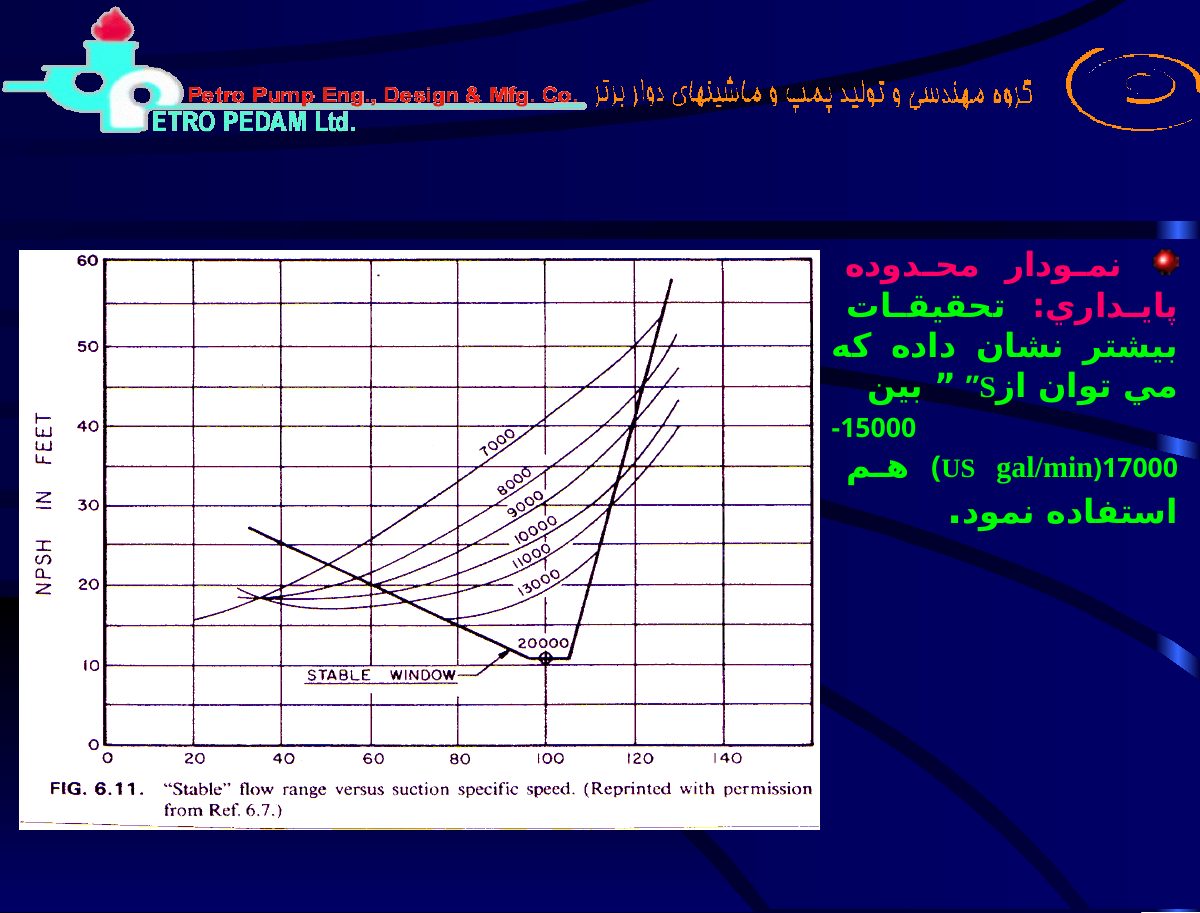
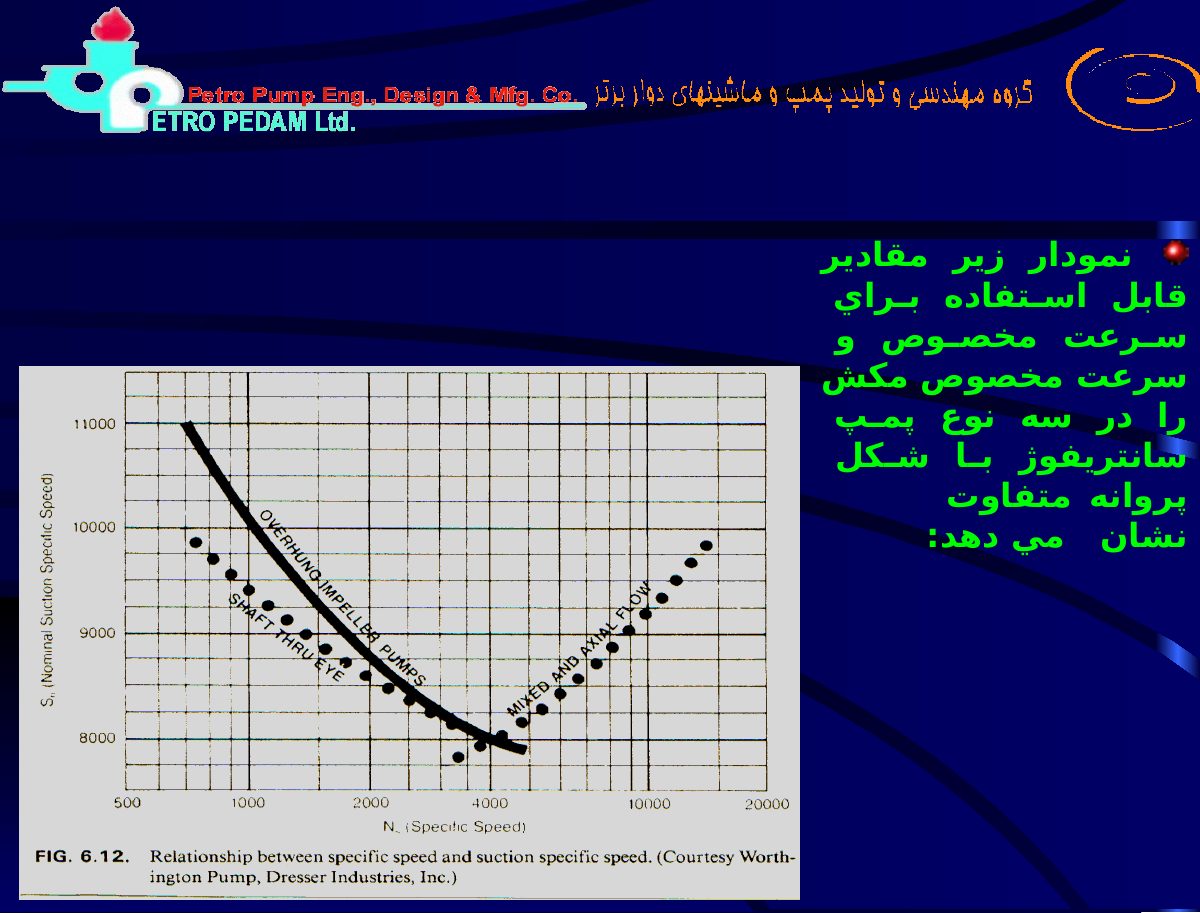
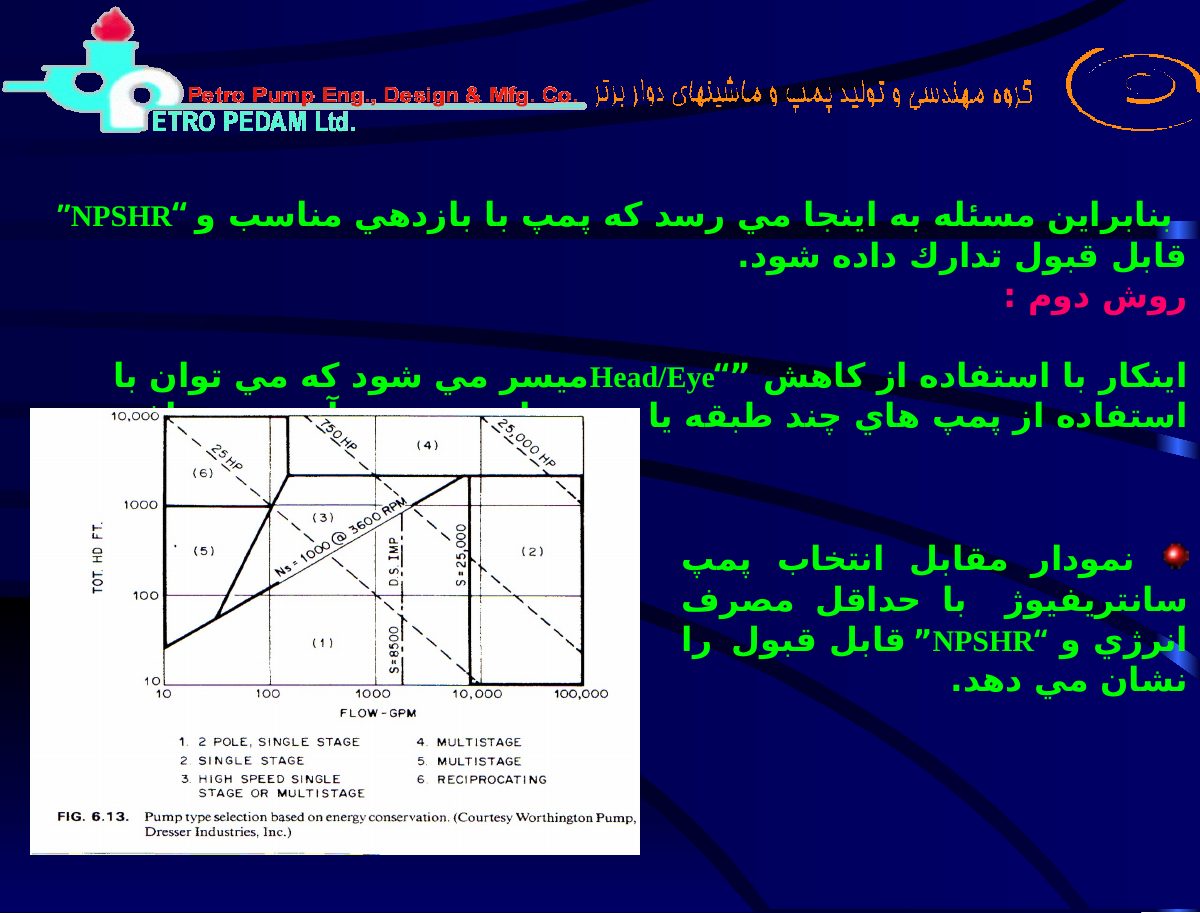
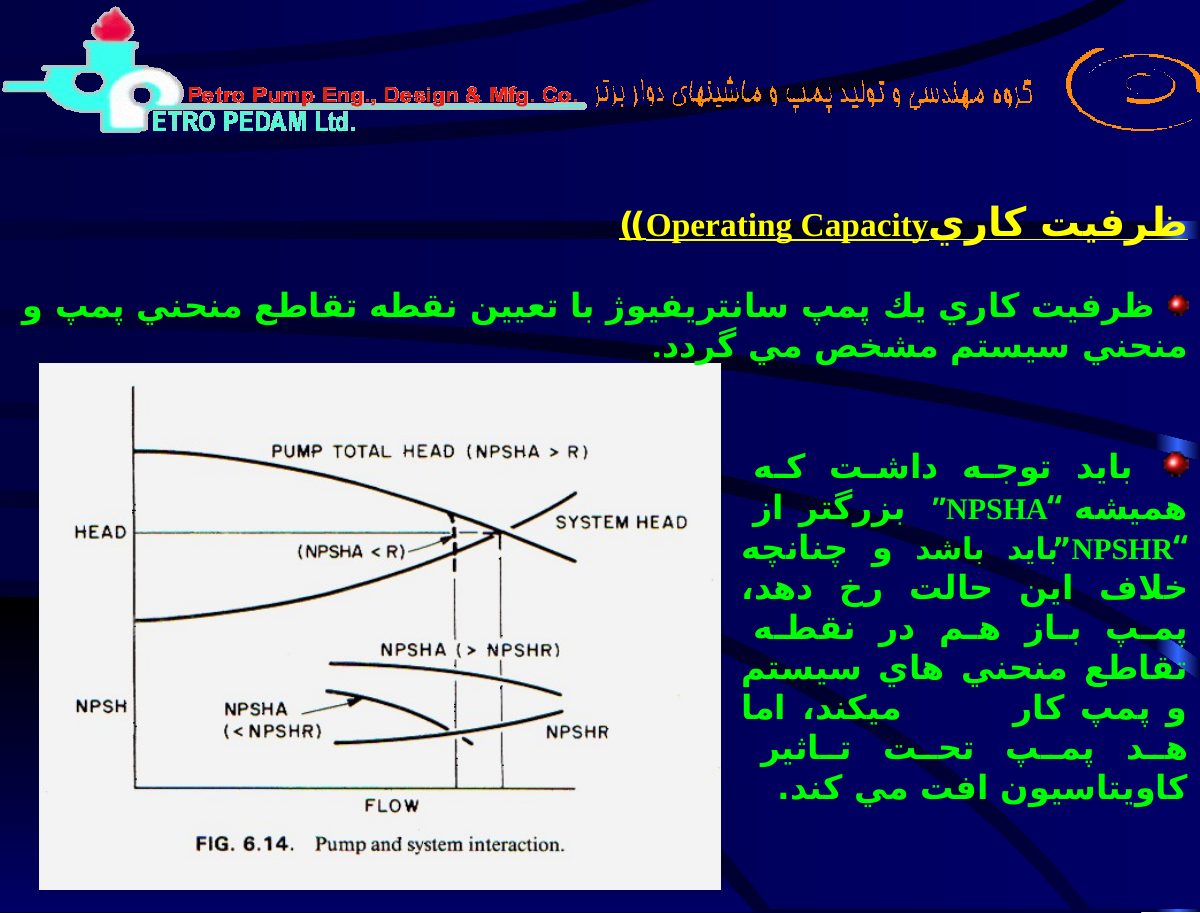
Original pages 61–72
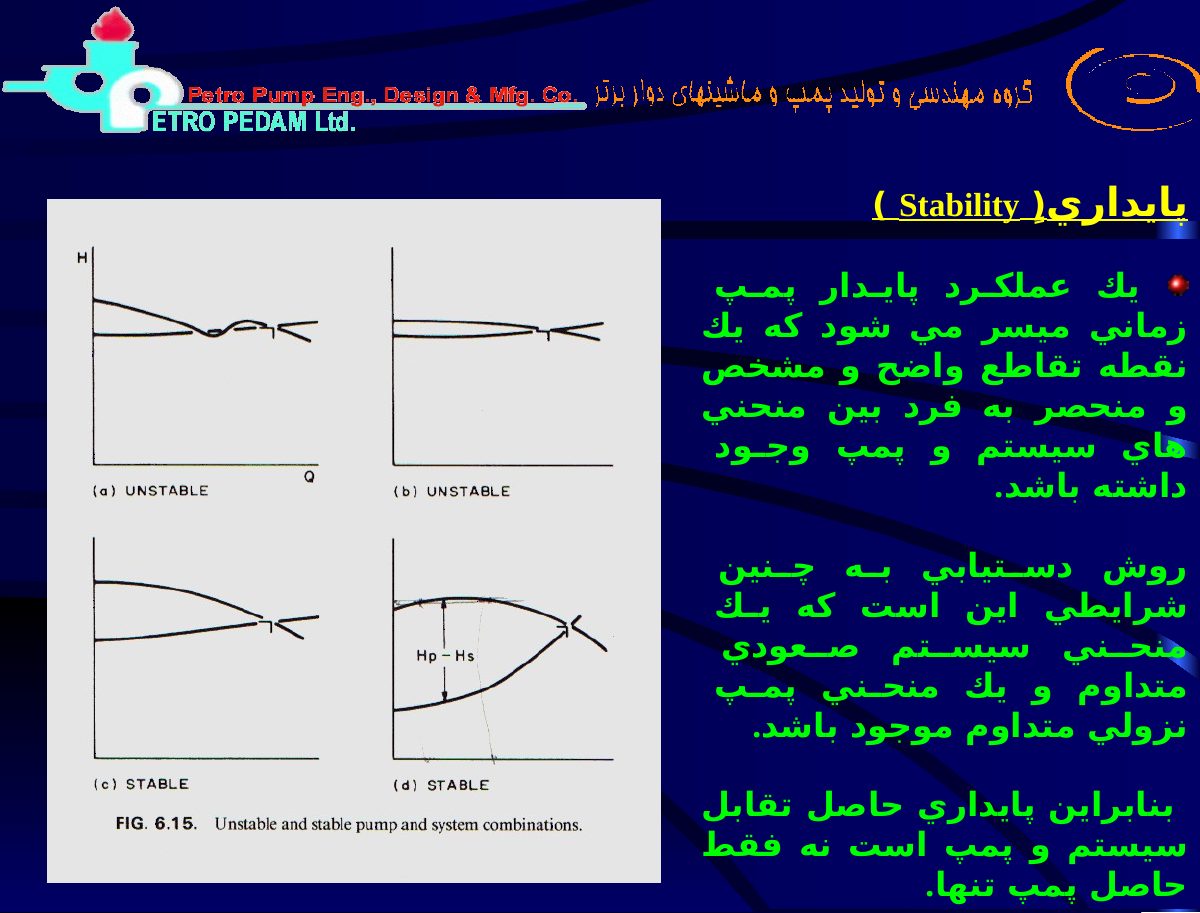
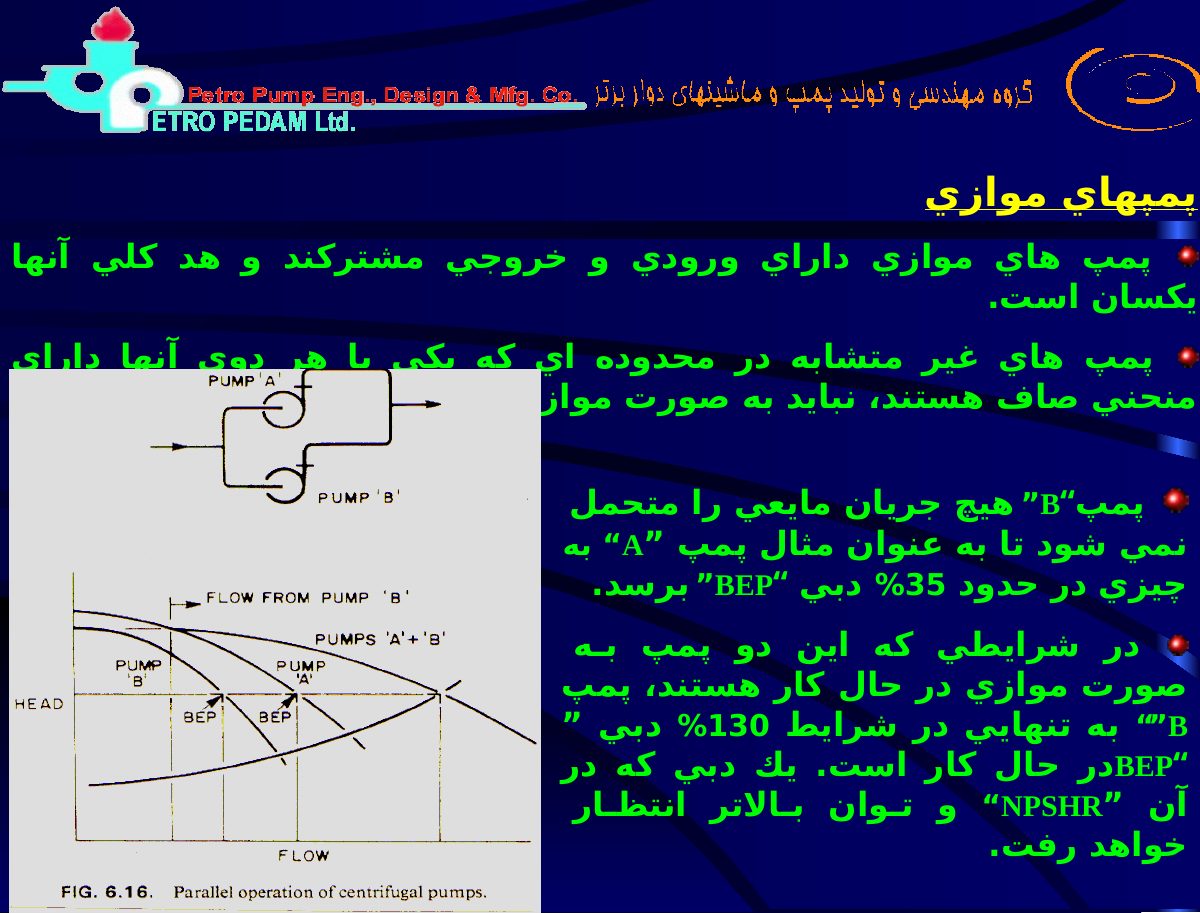
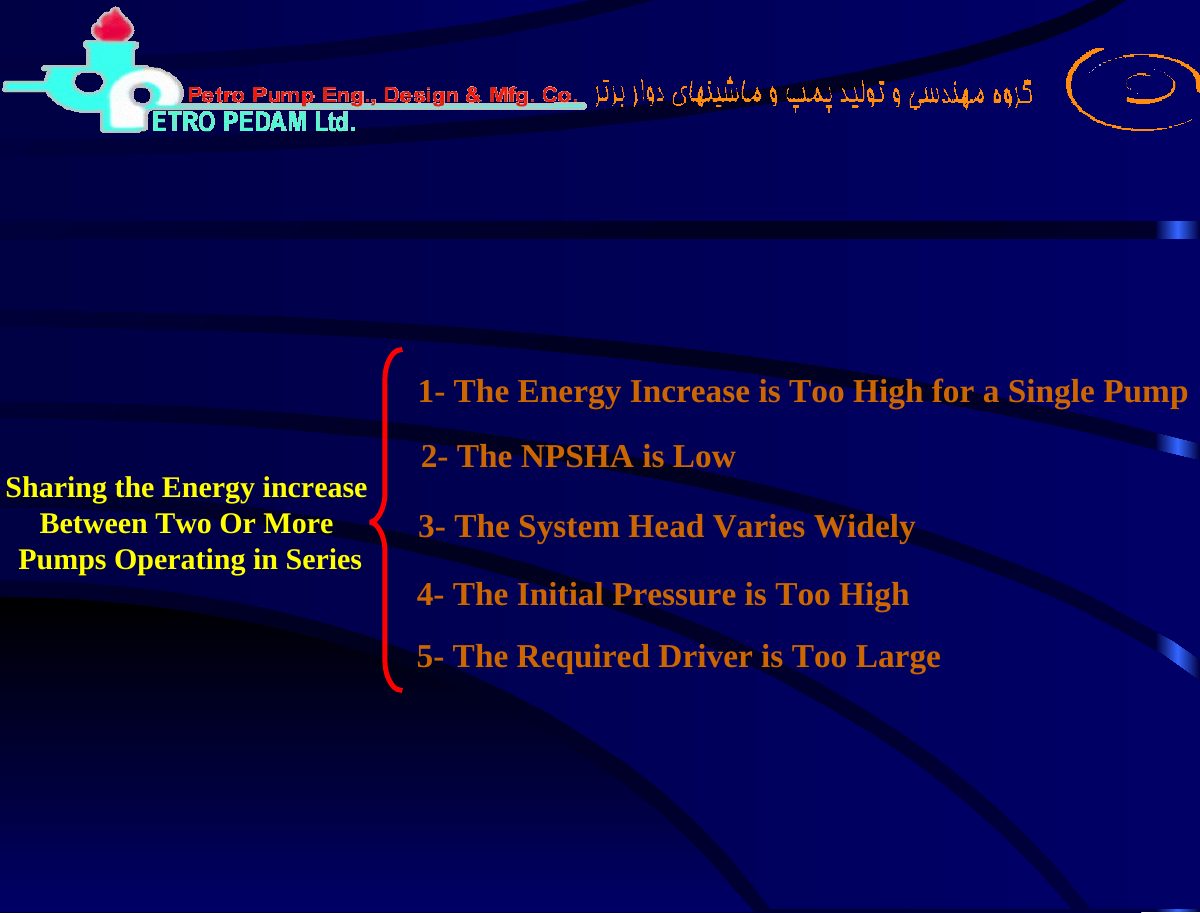
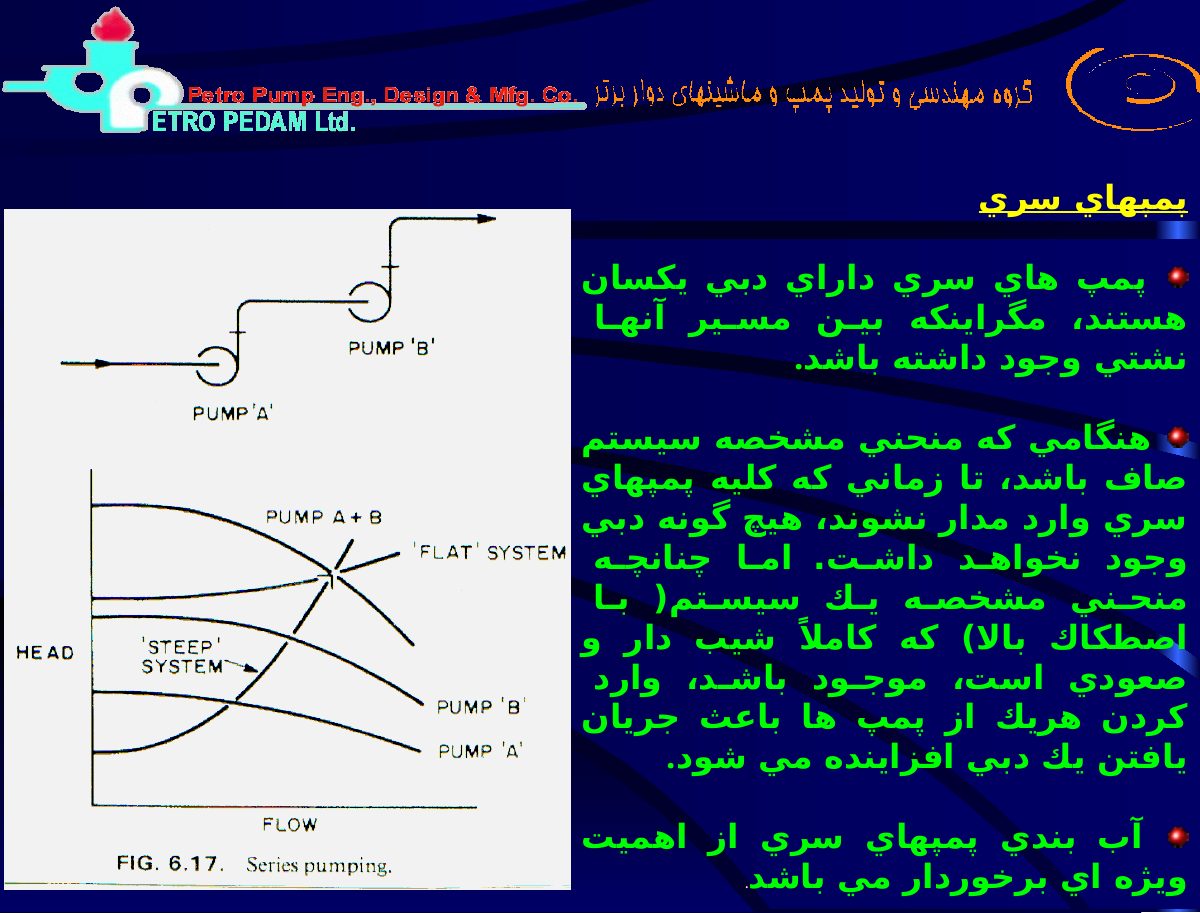
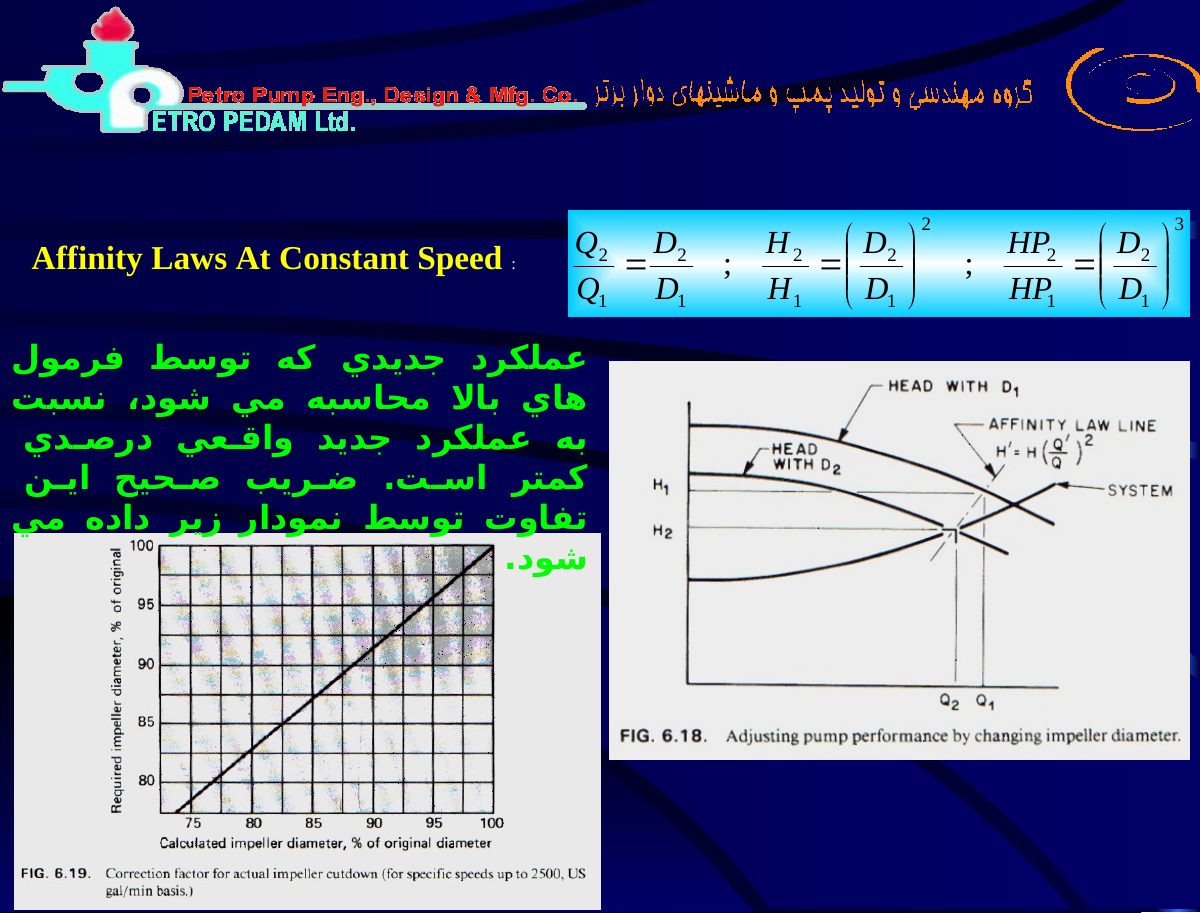
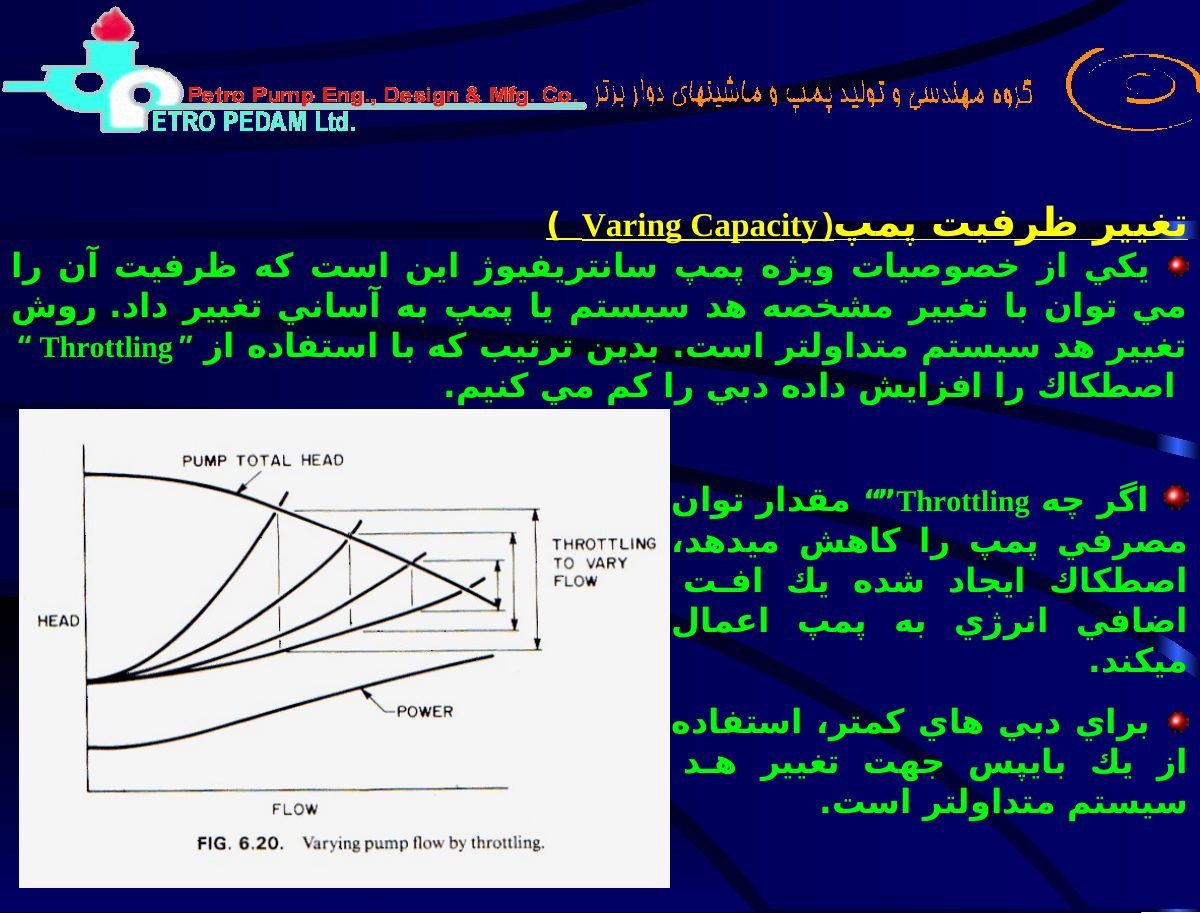
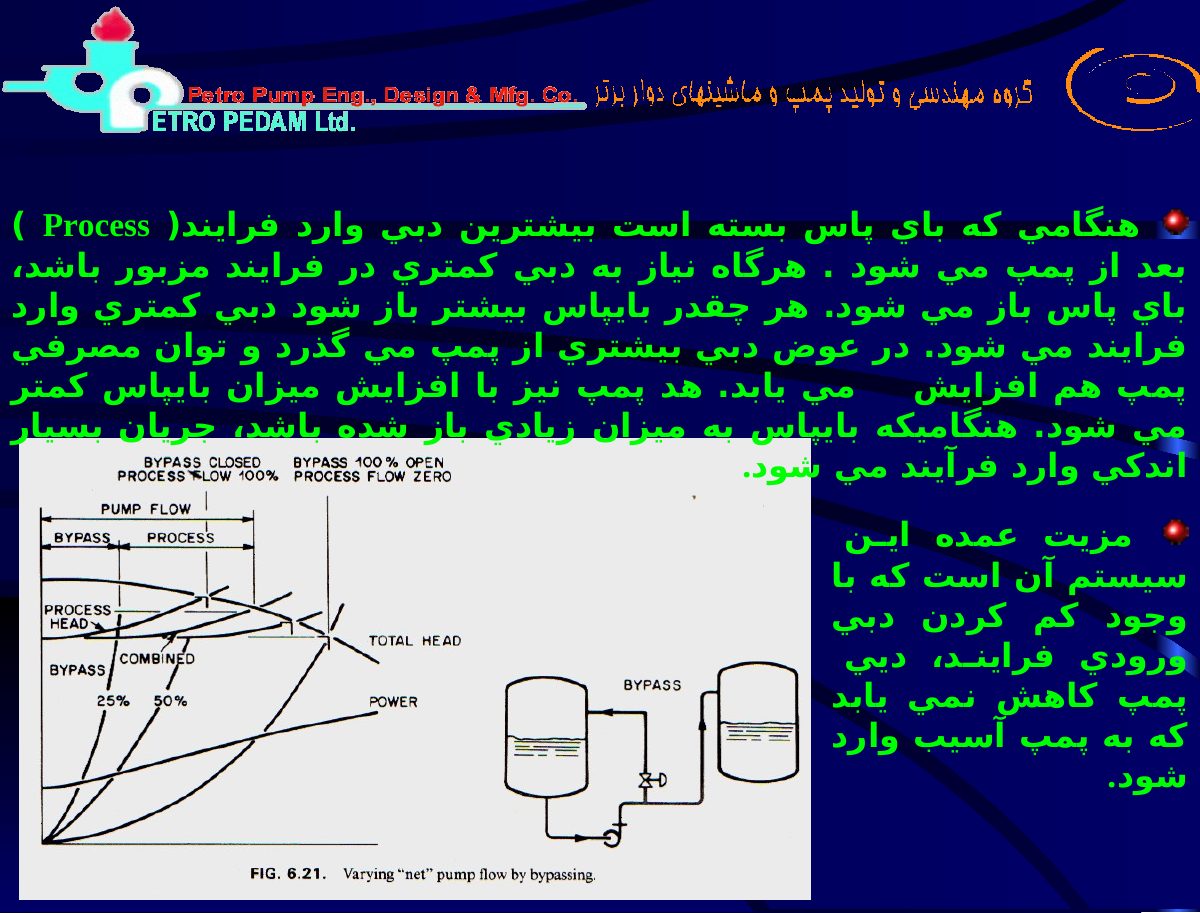
Original pages 73–84
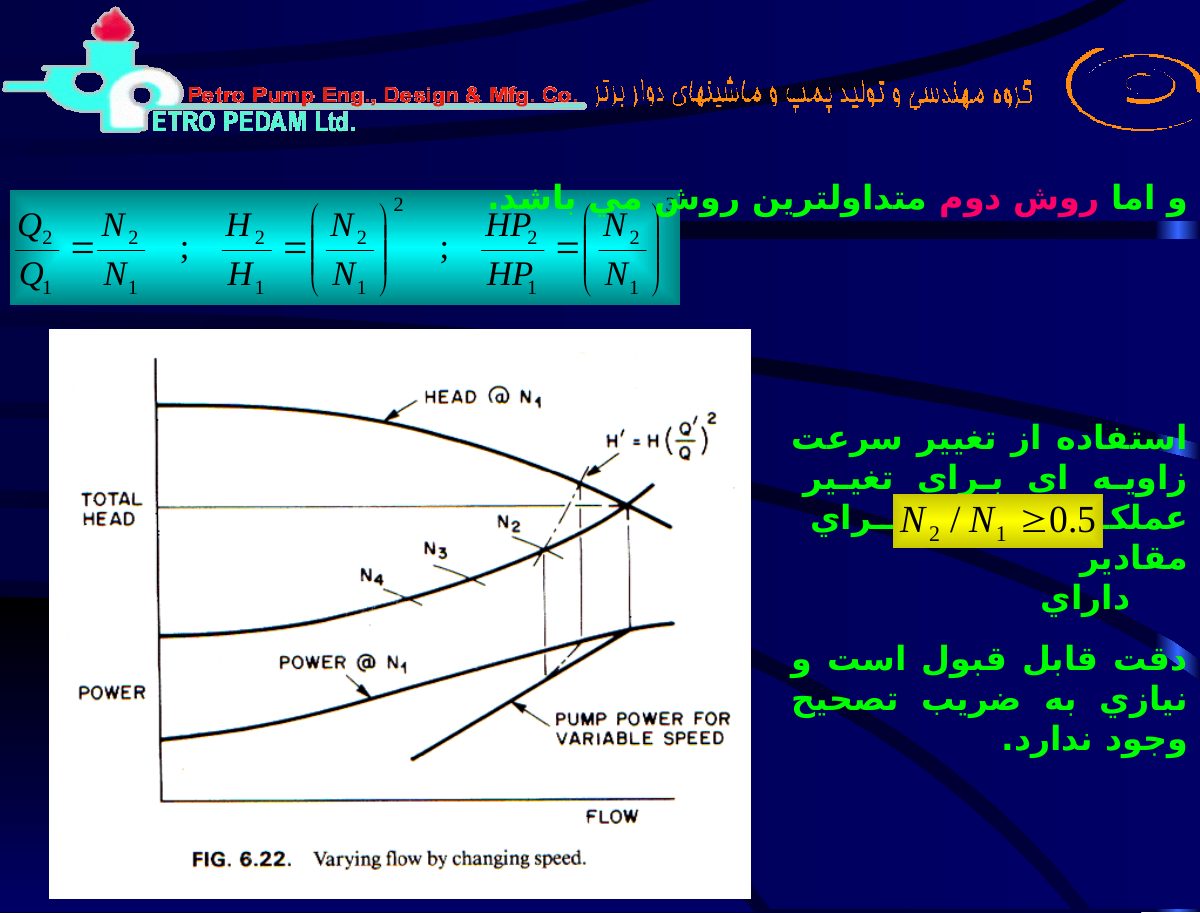
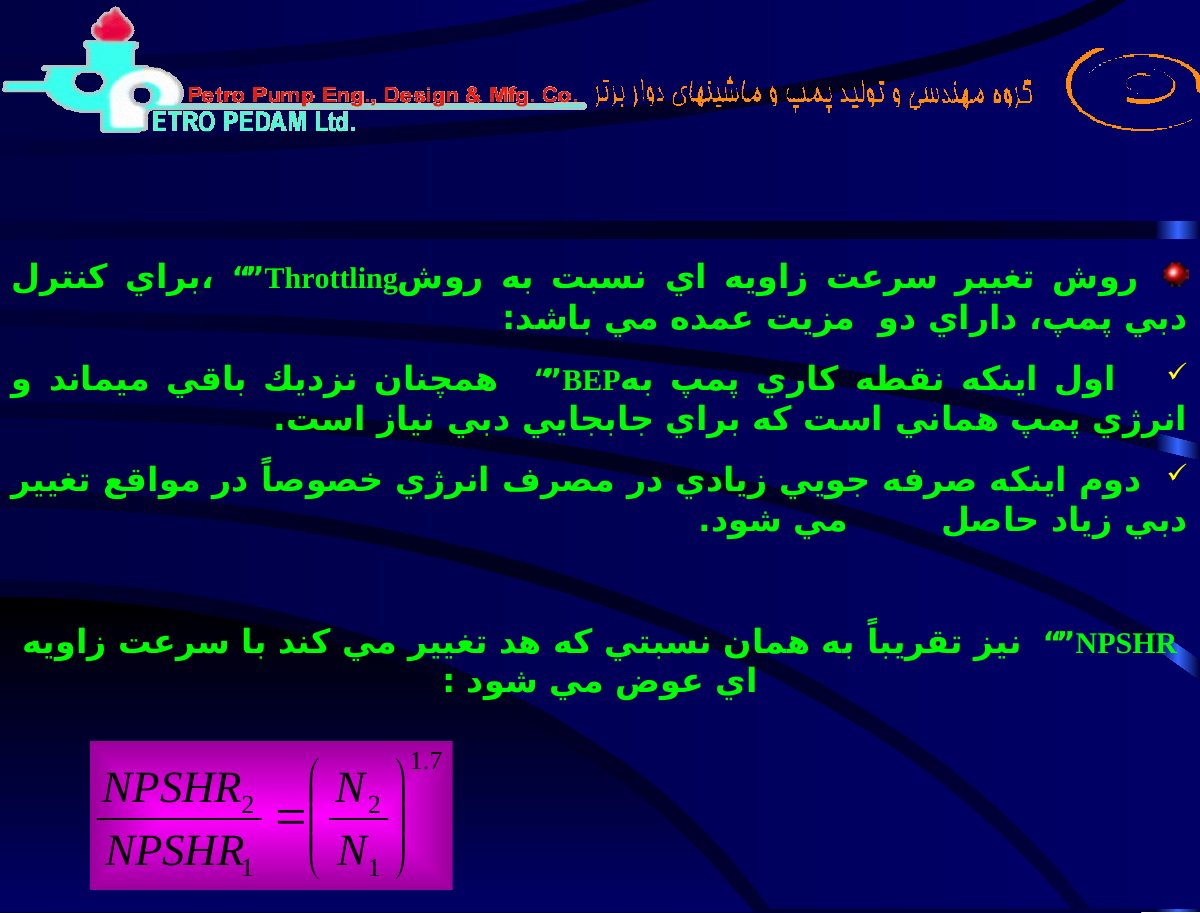
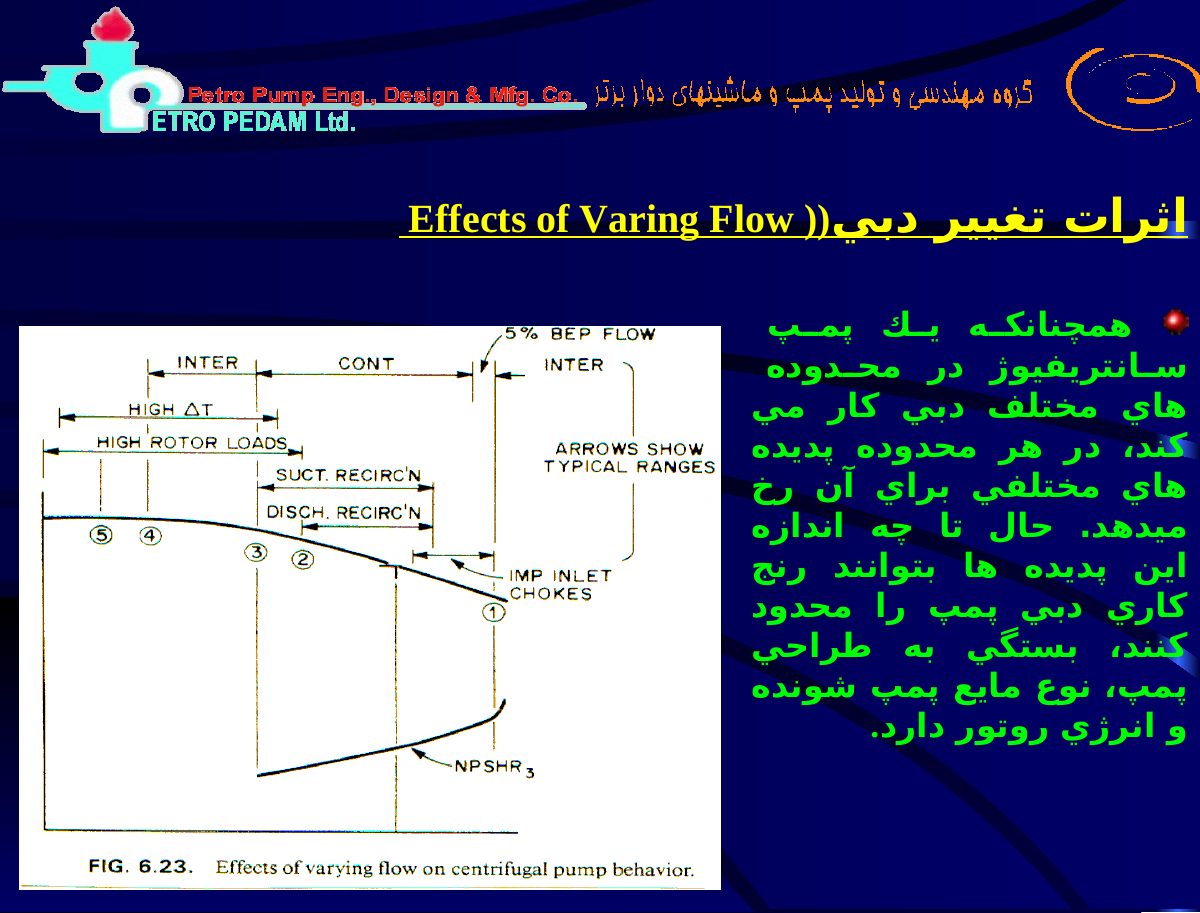
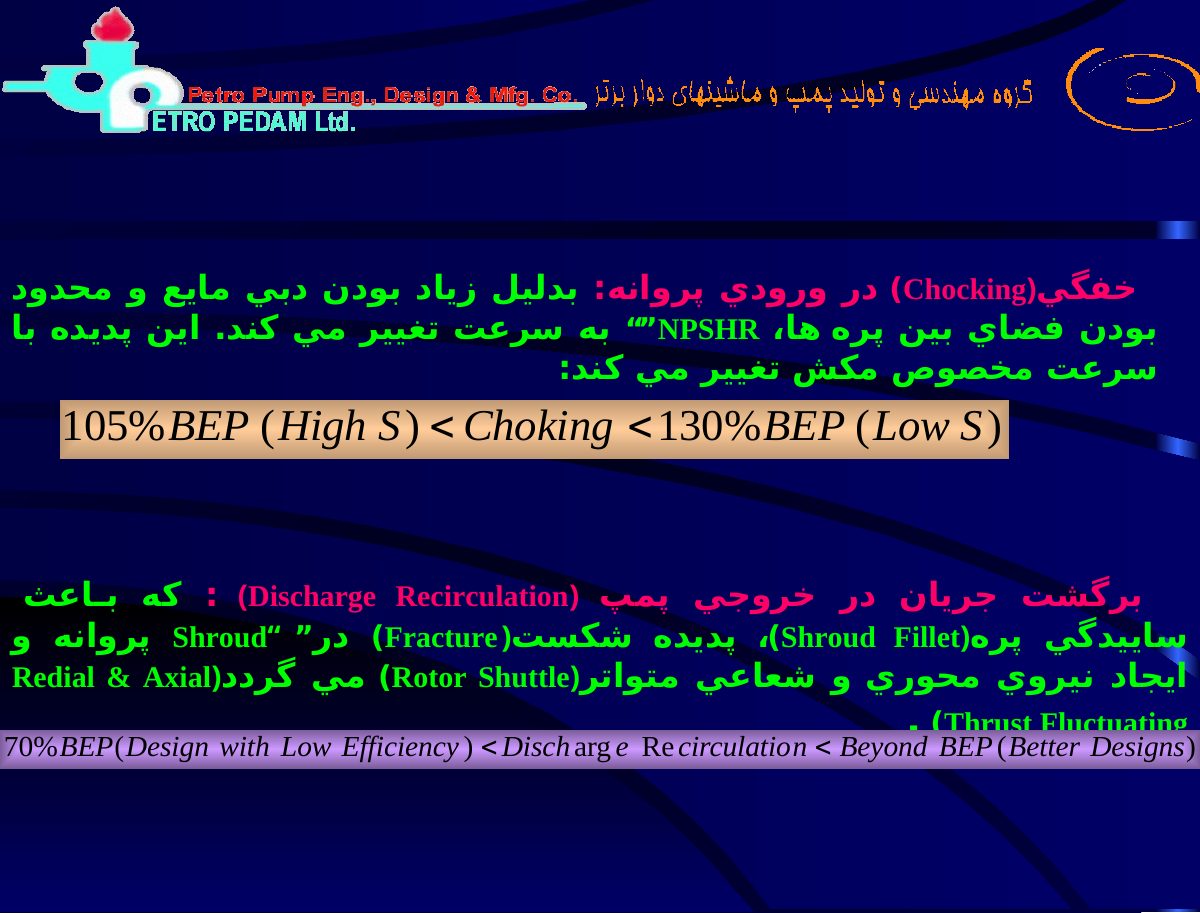
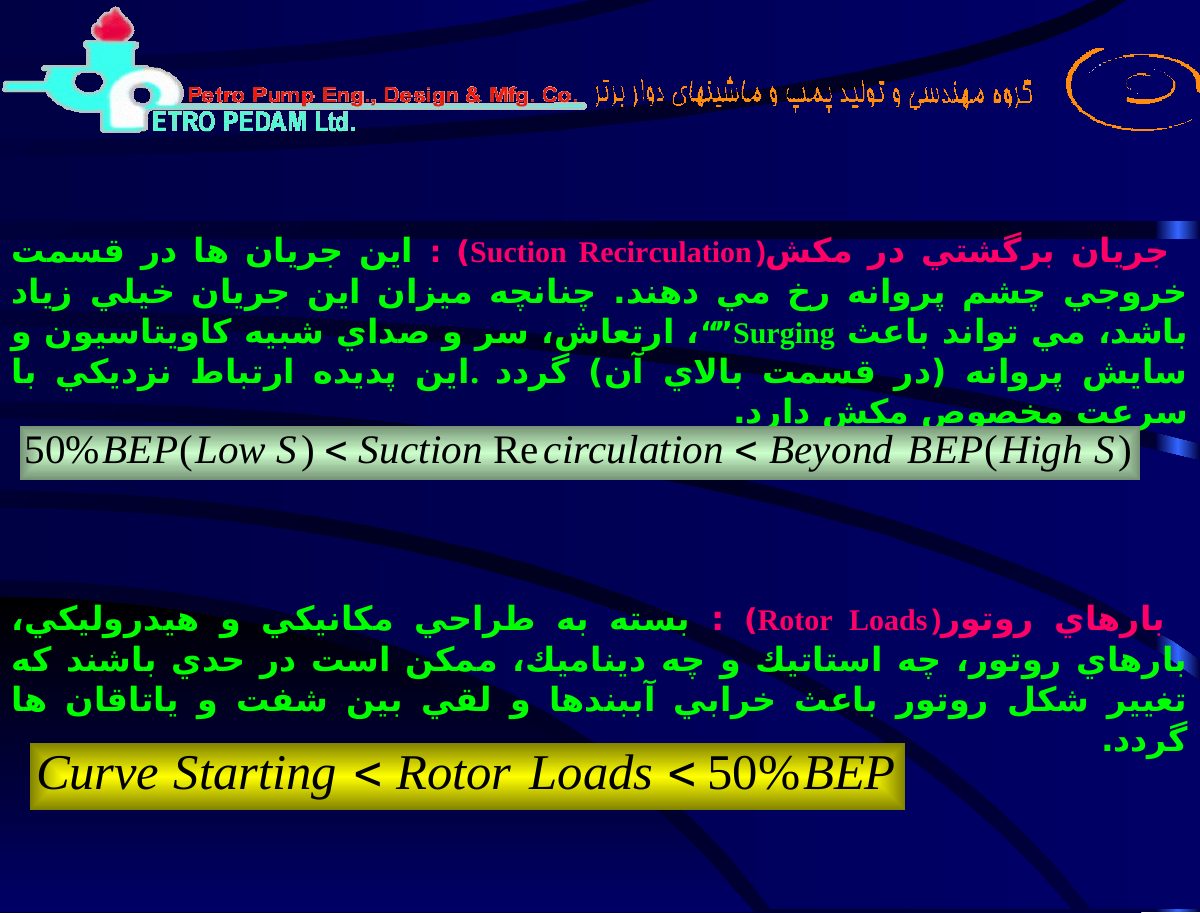
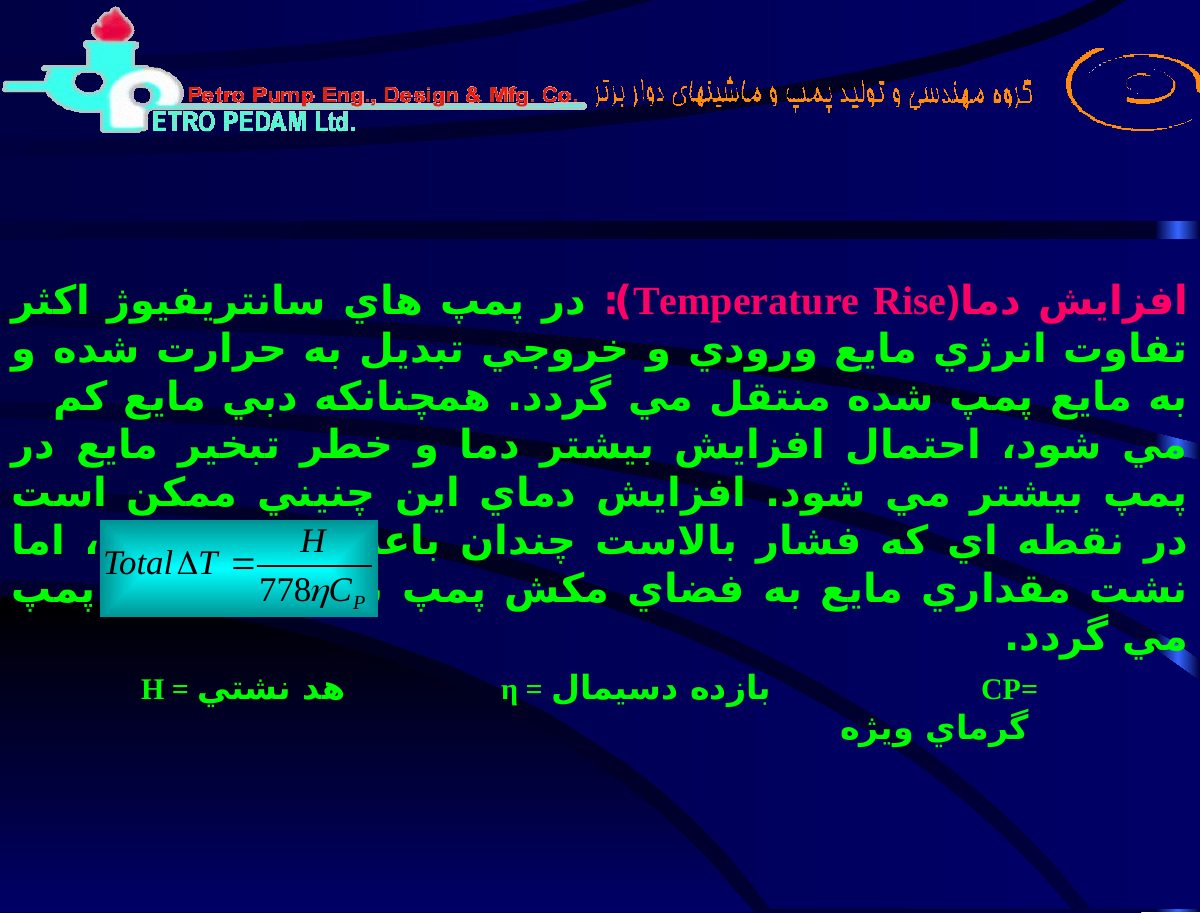
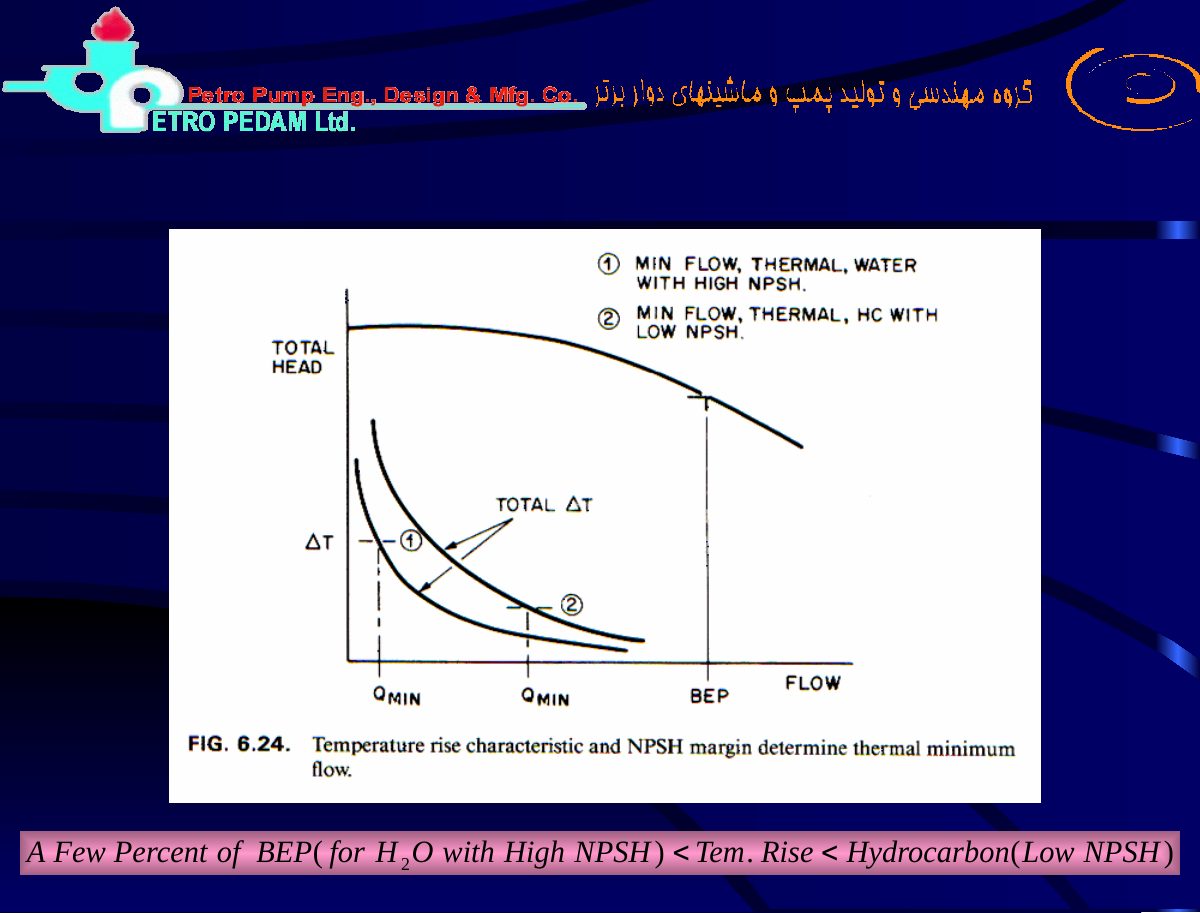
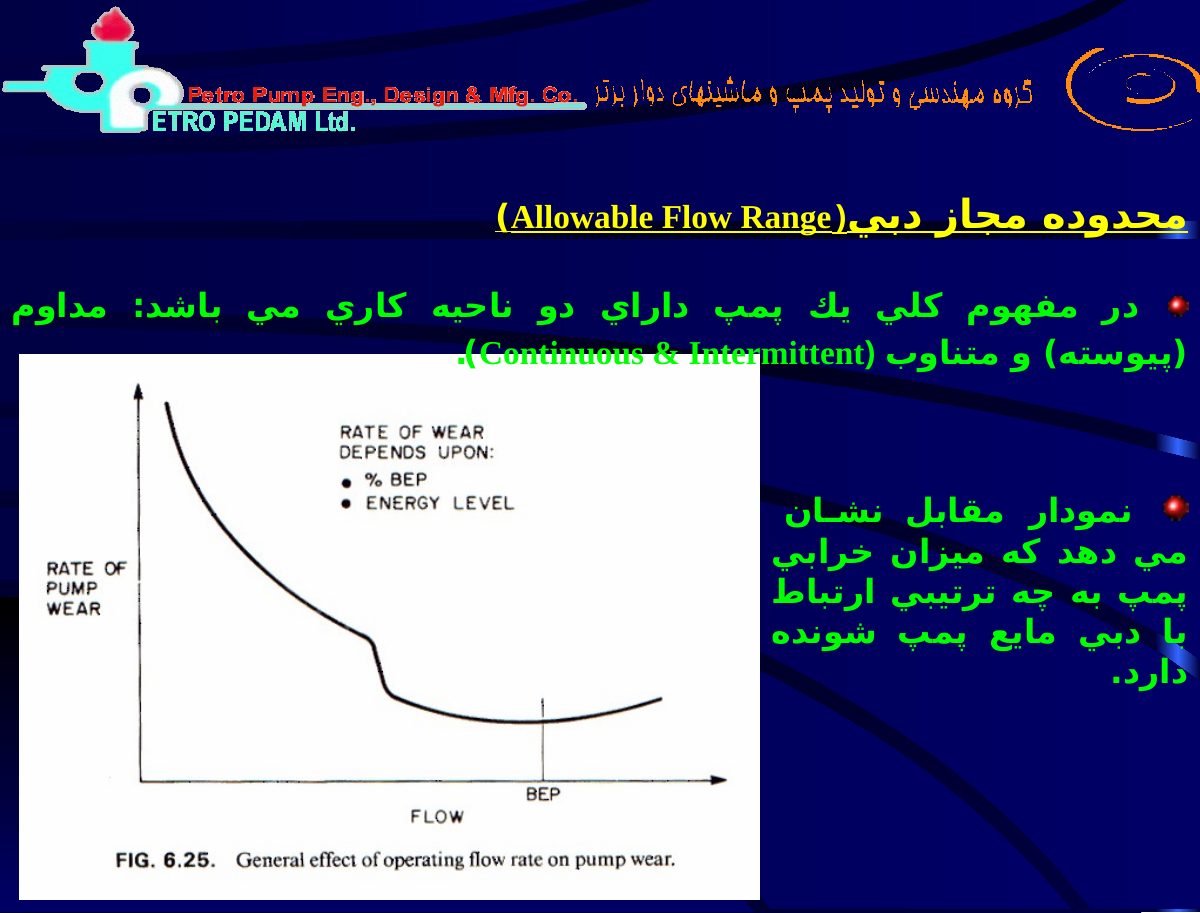
Original pages 85–96
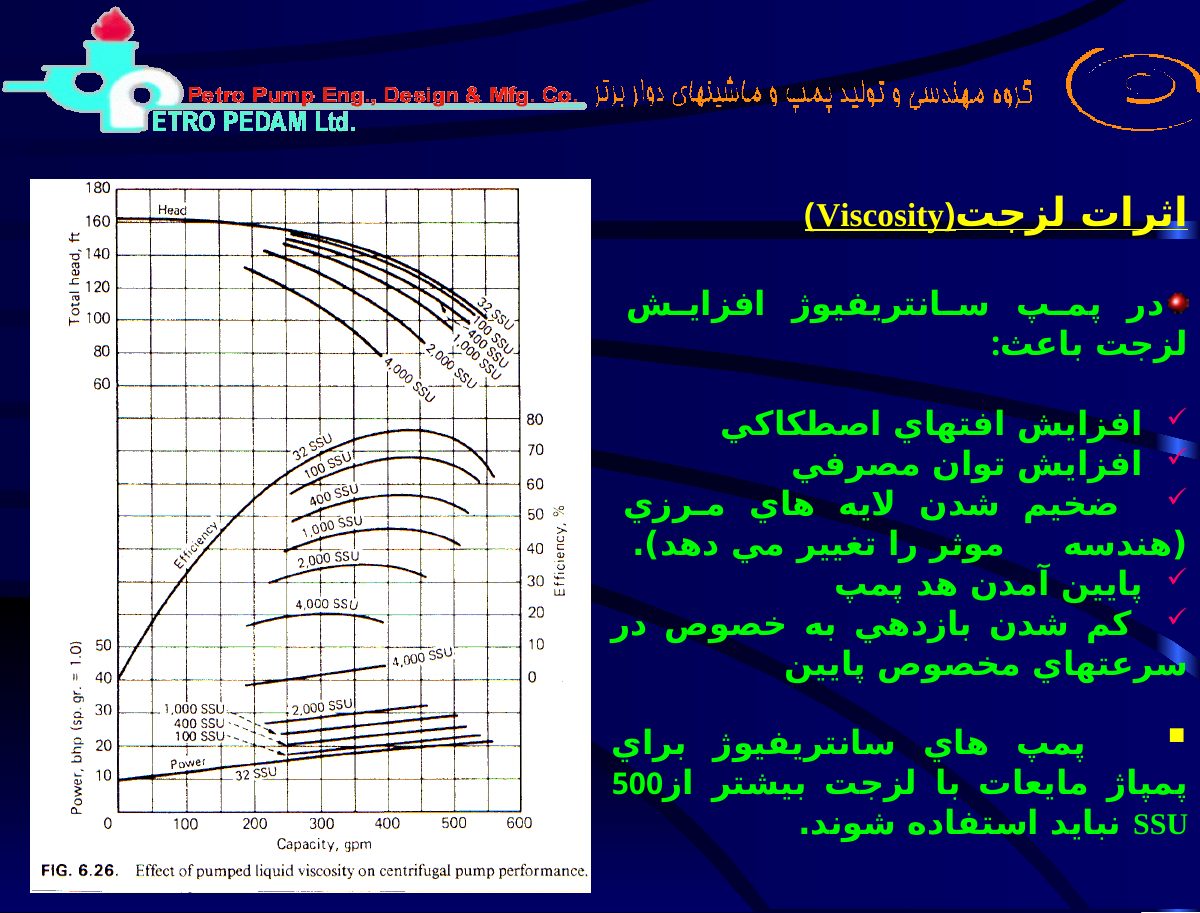
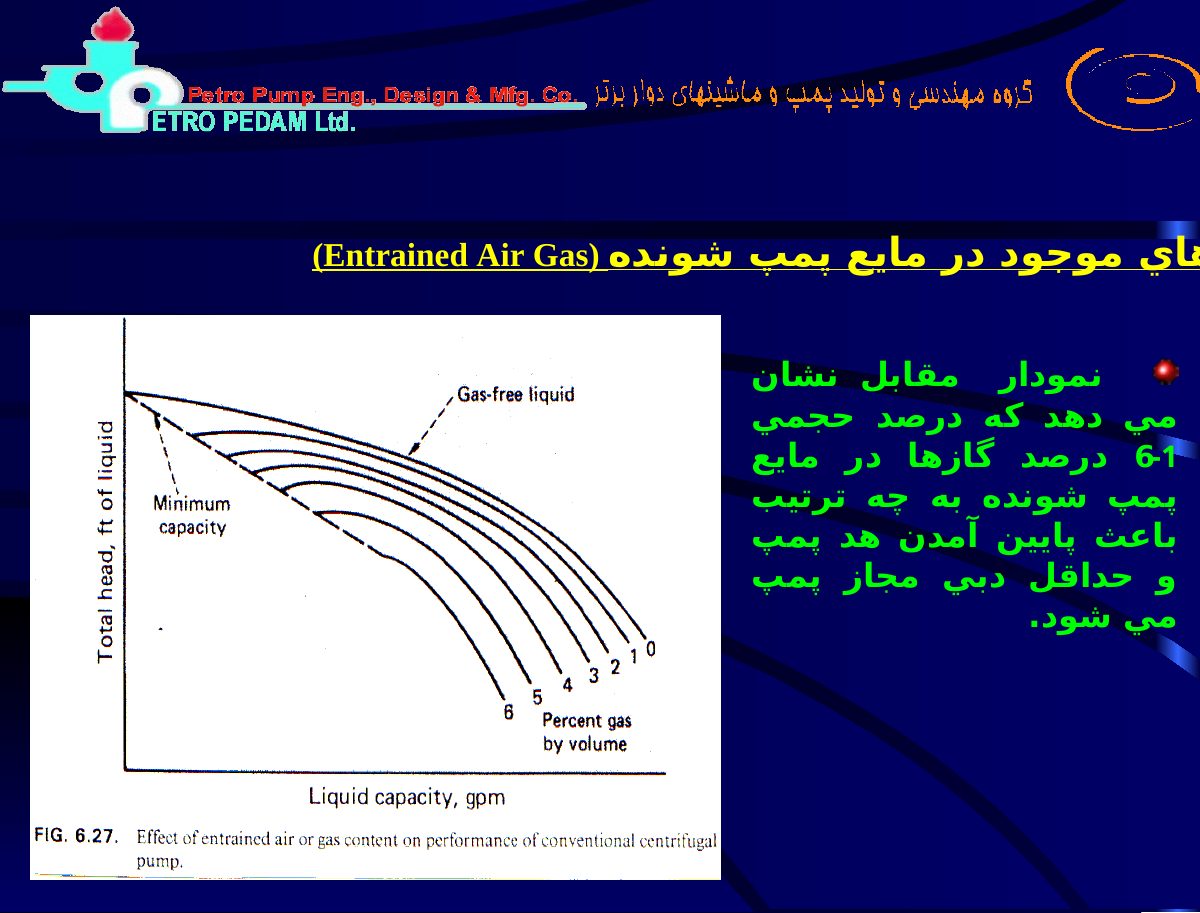
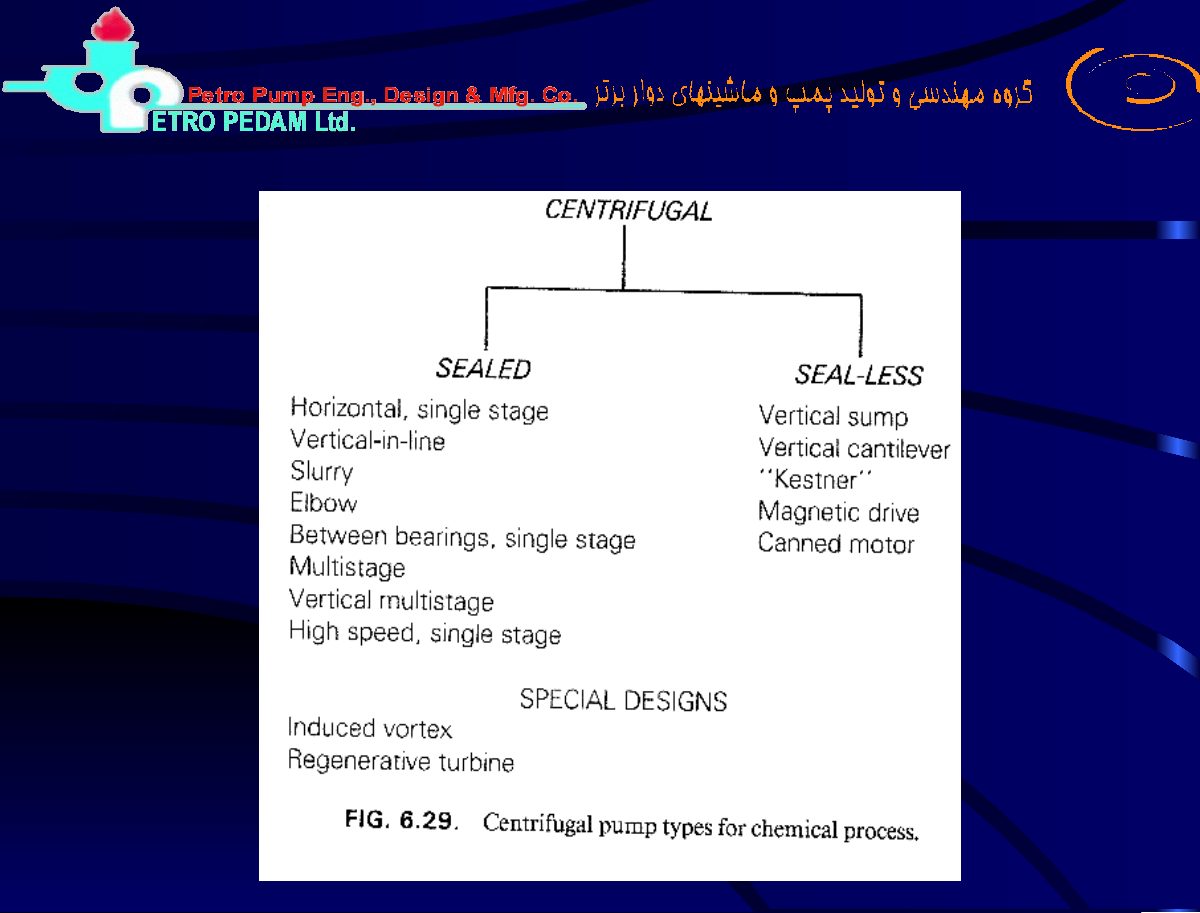
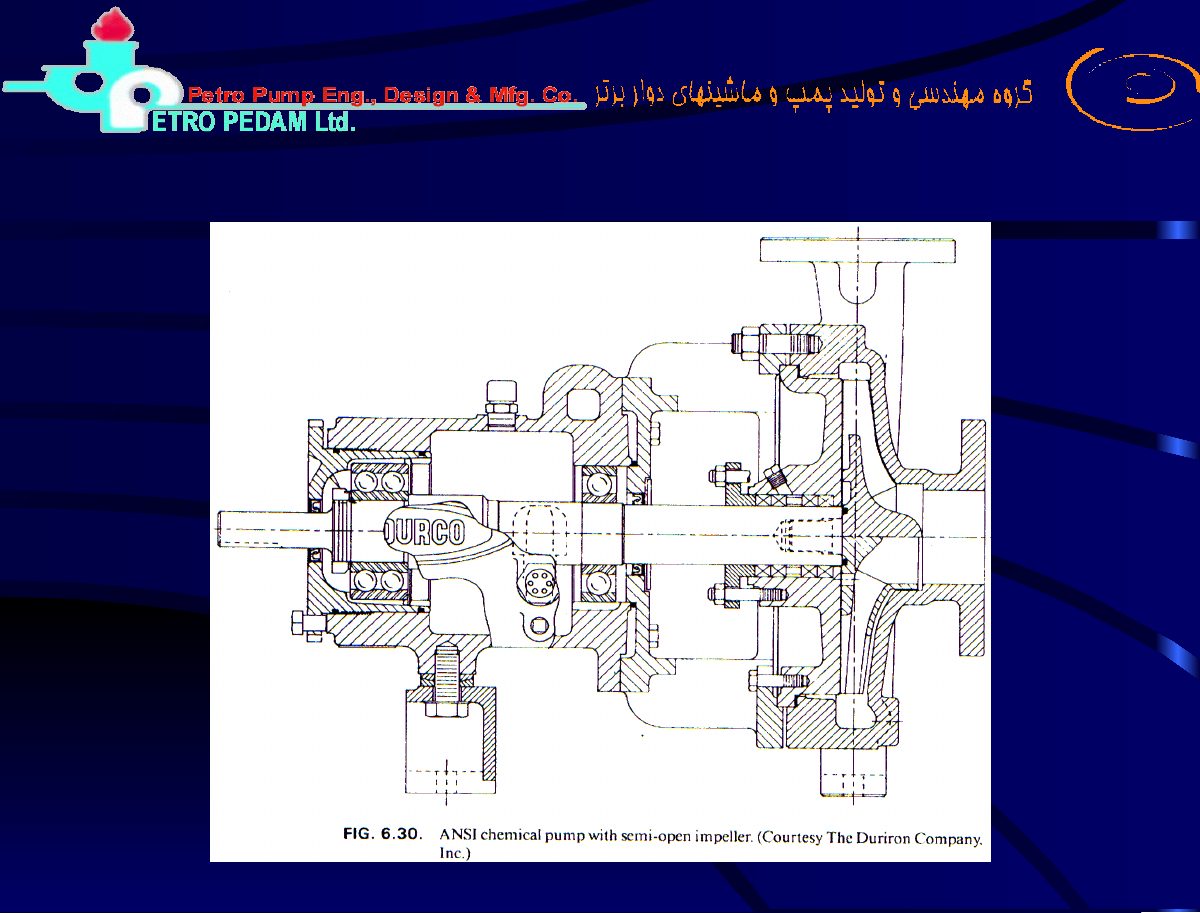
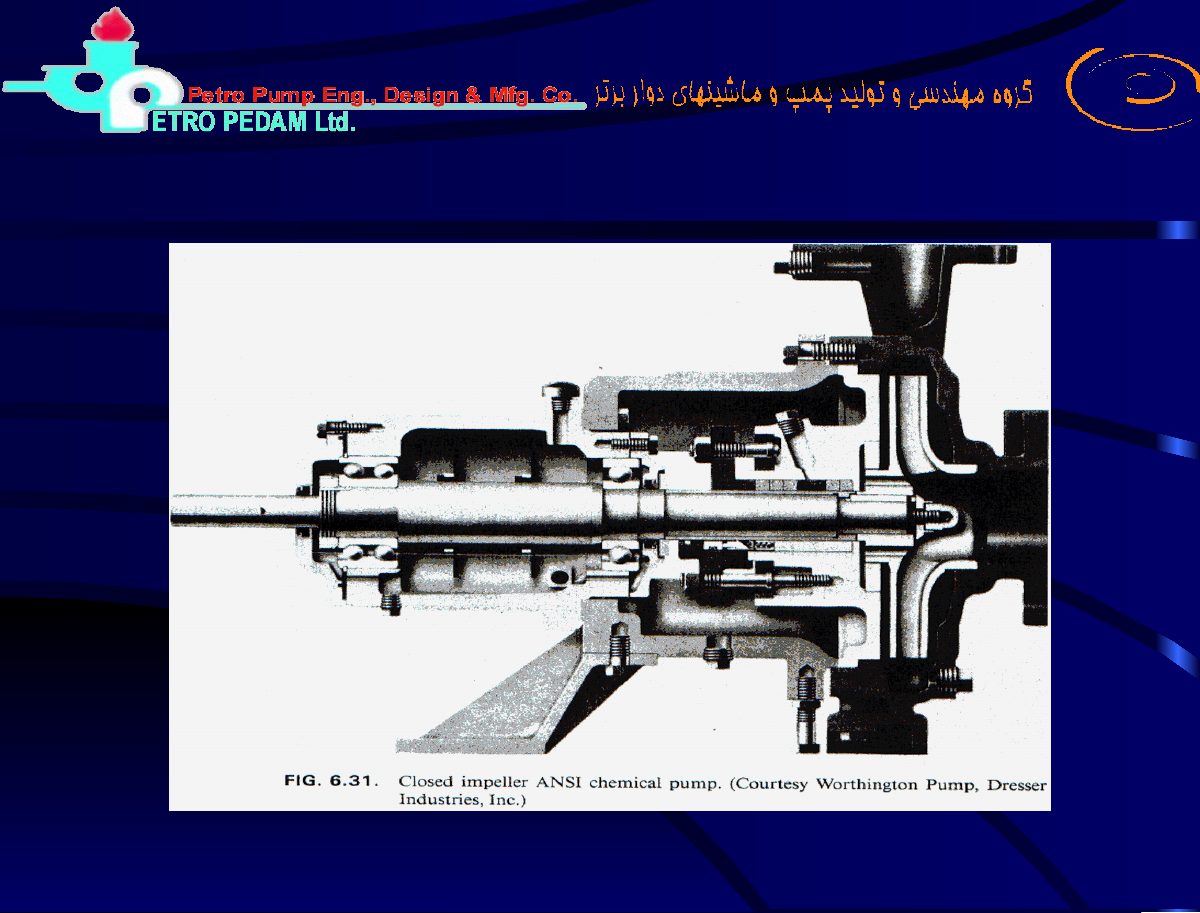
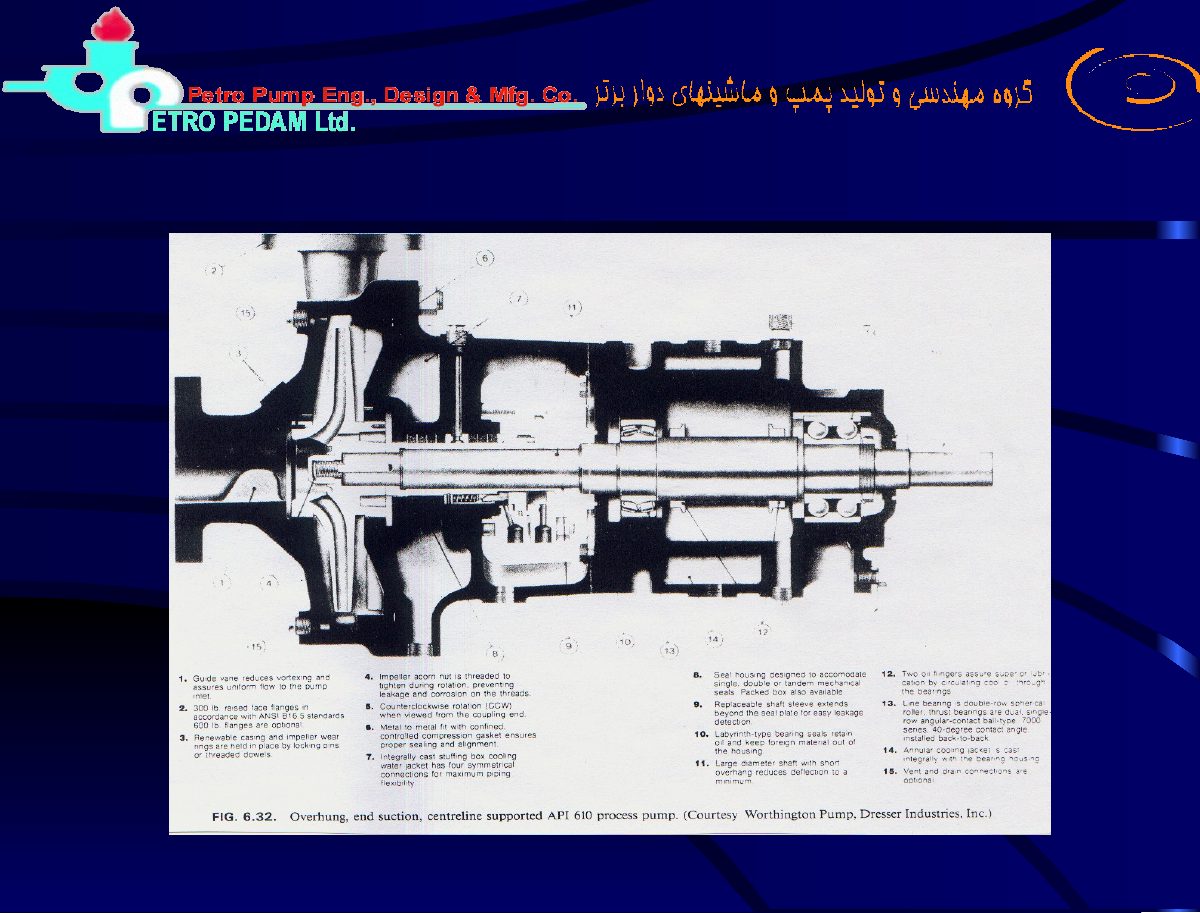
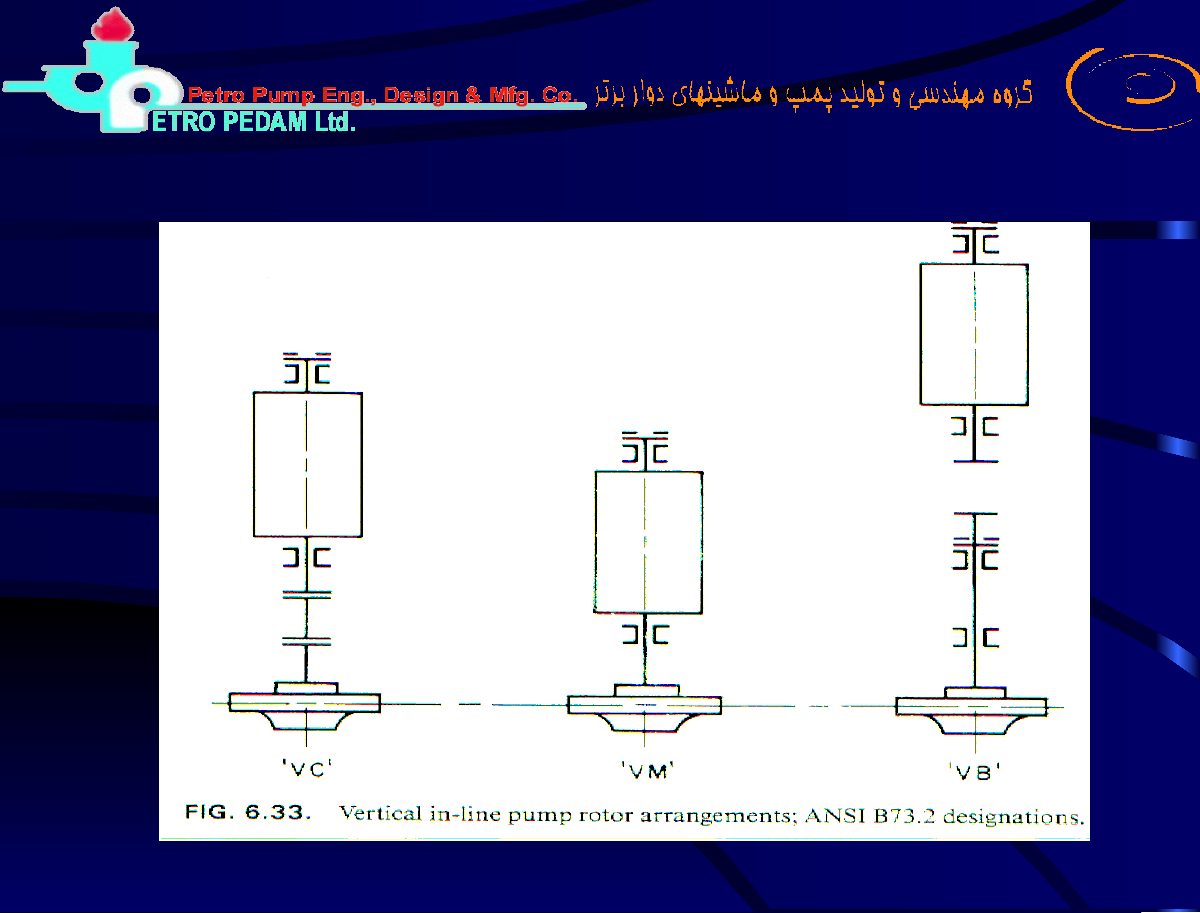
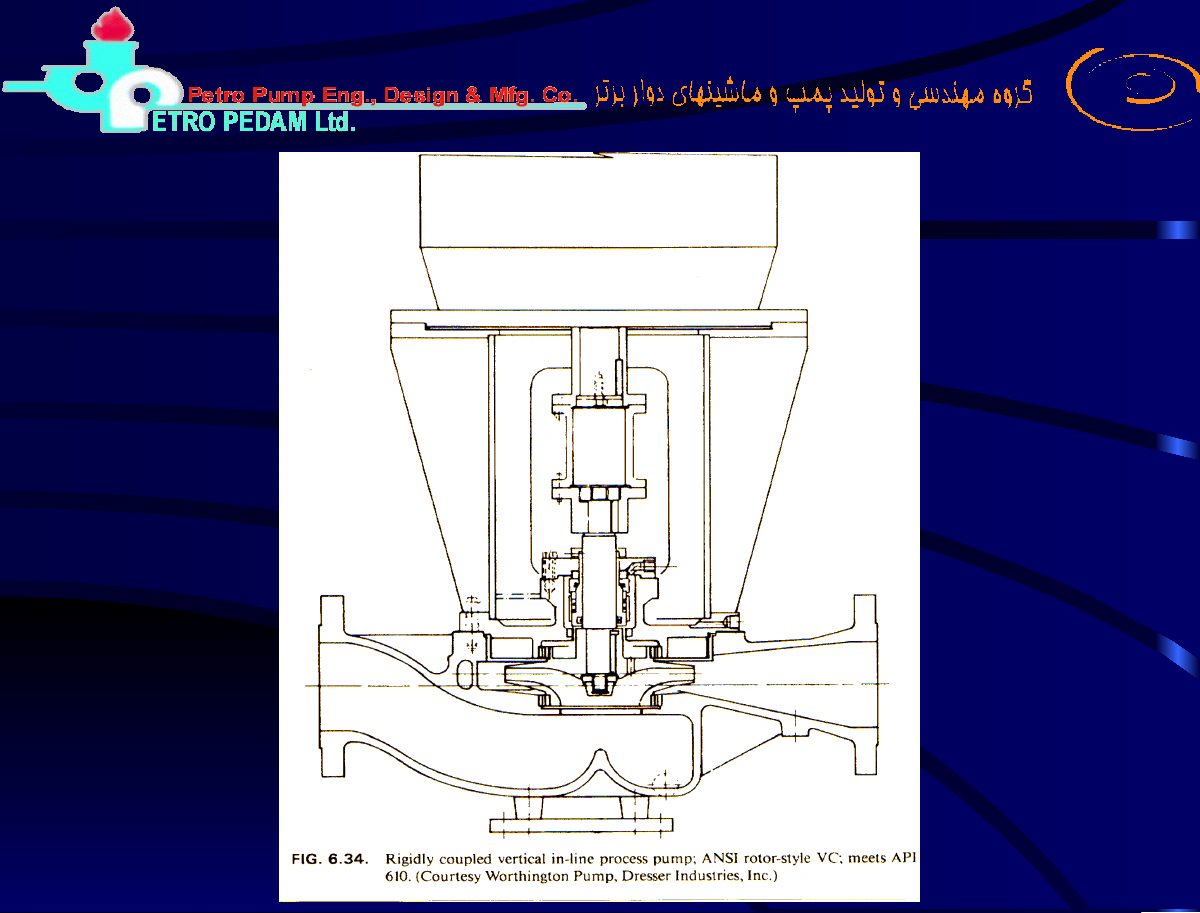
Original pages 97–108
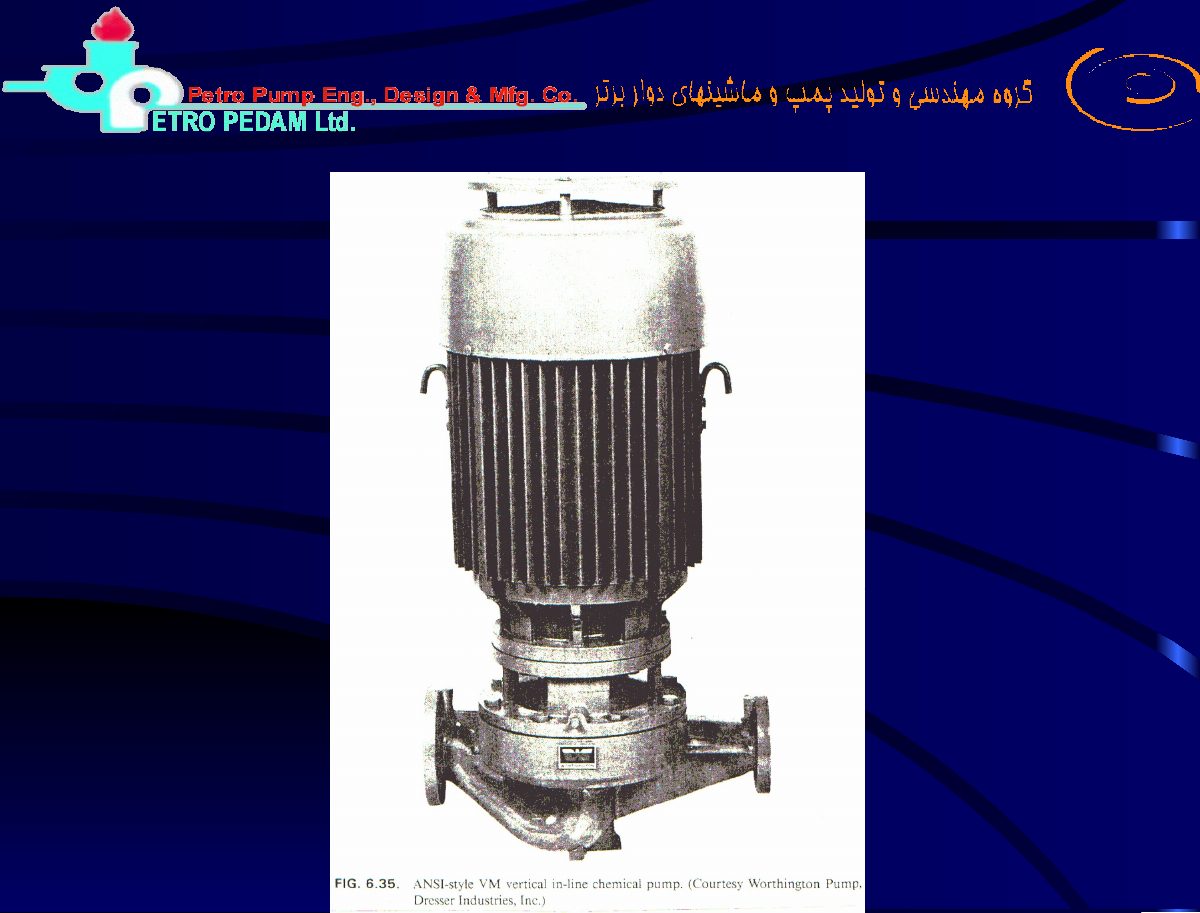
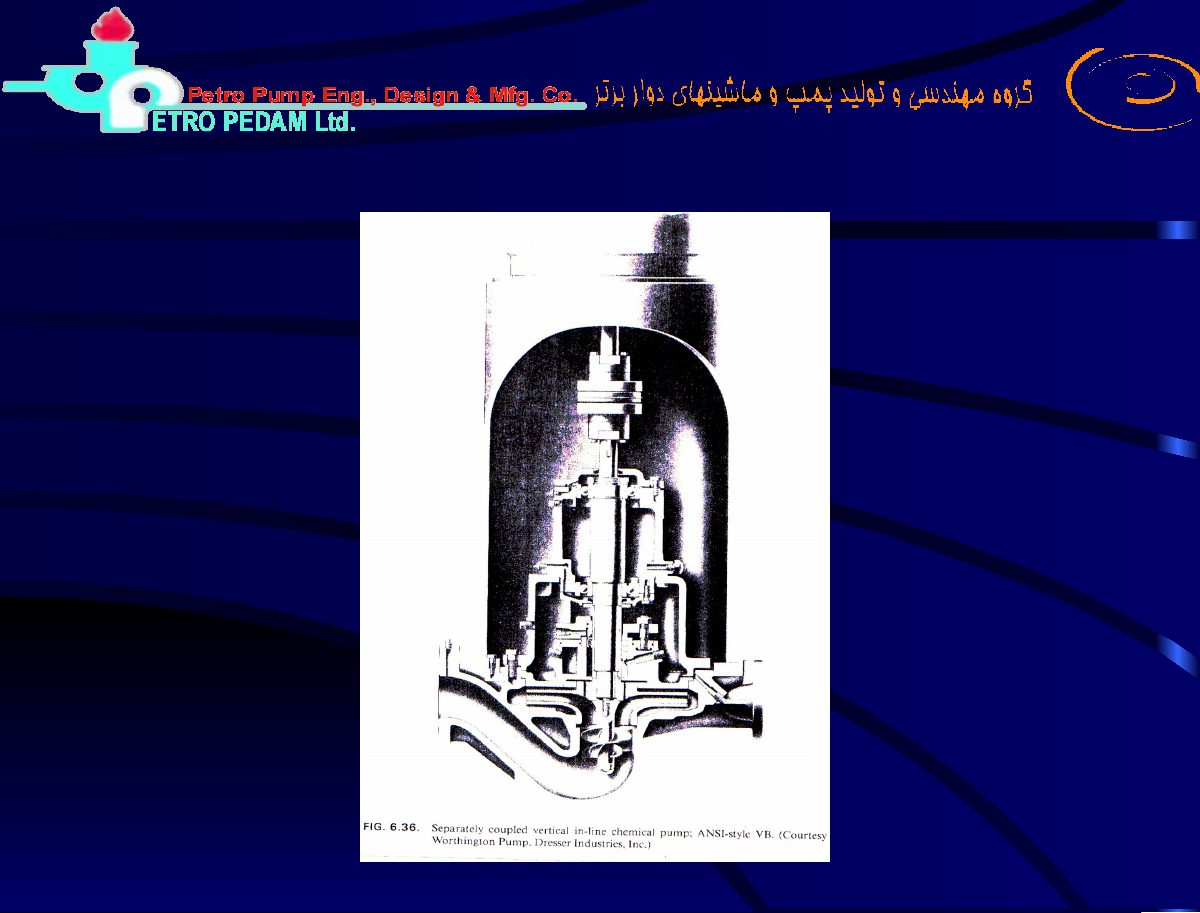
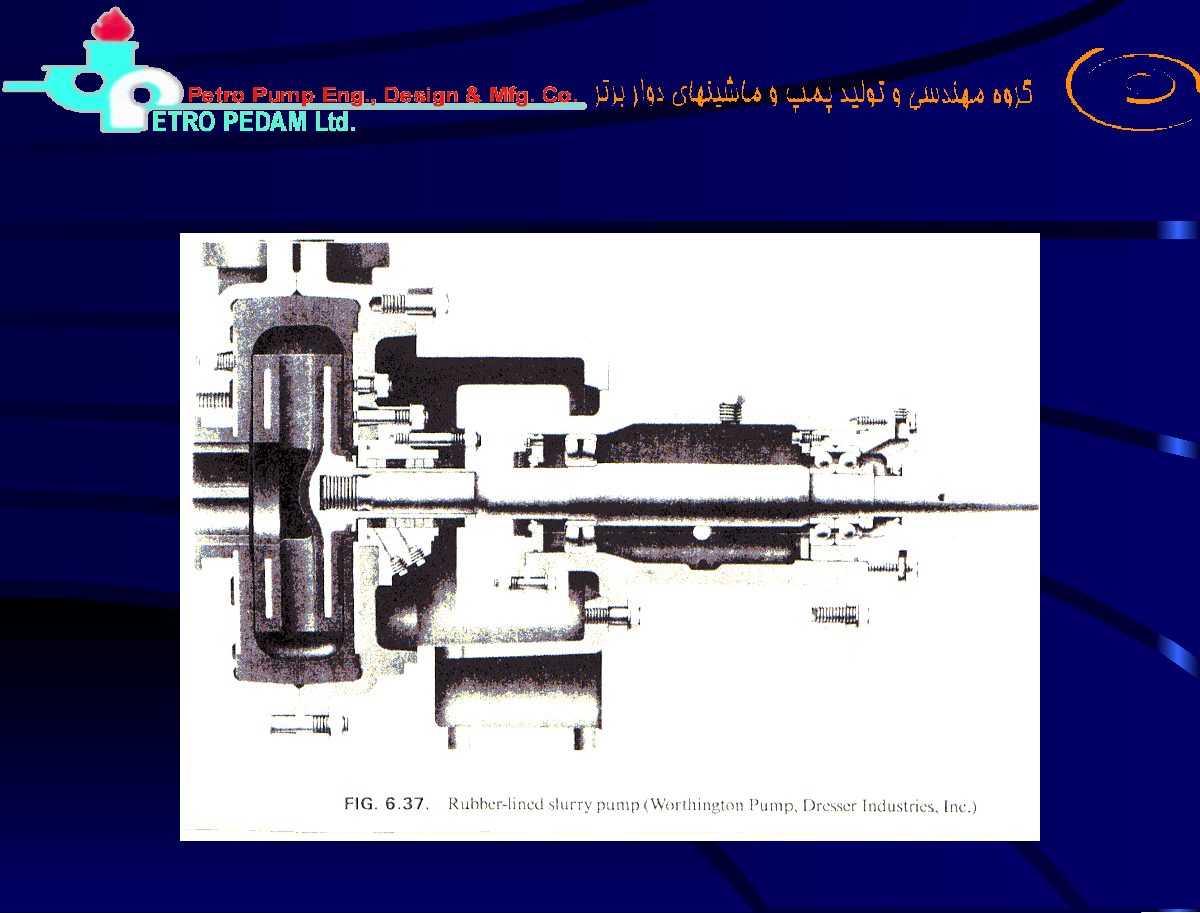
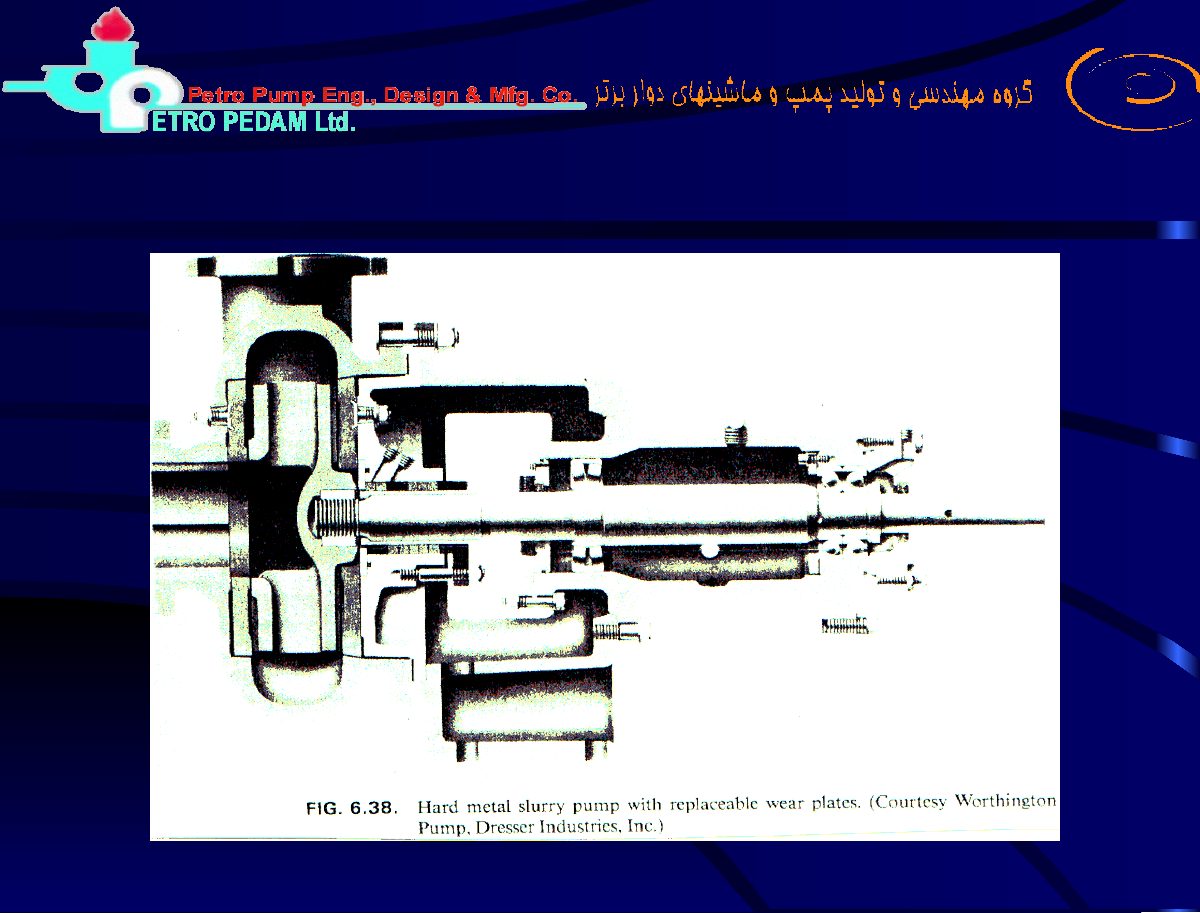
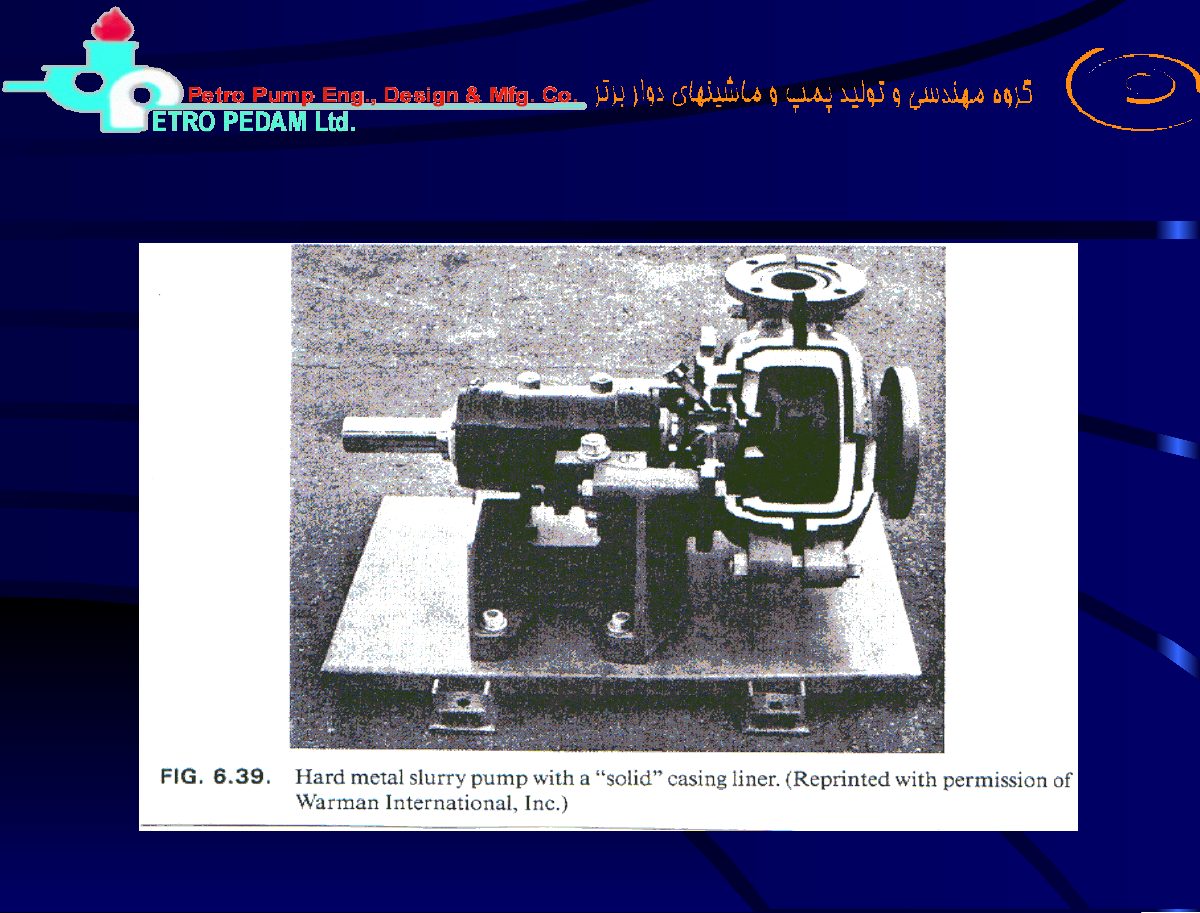
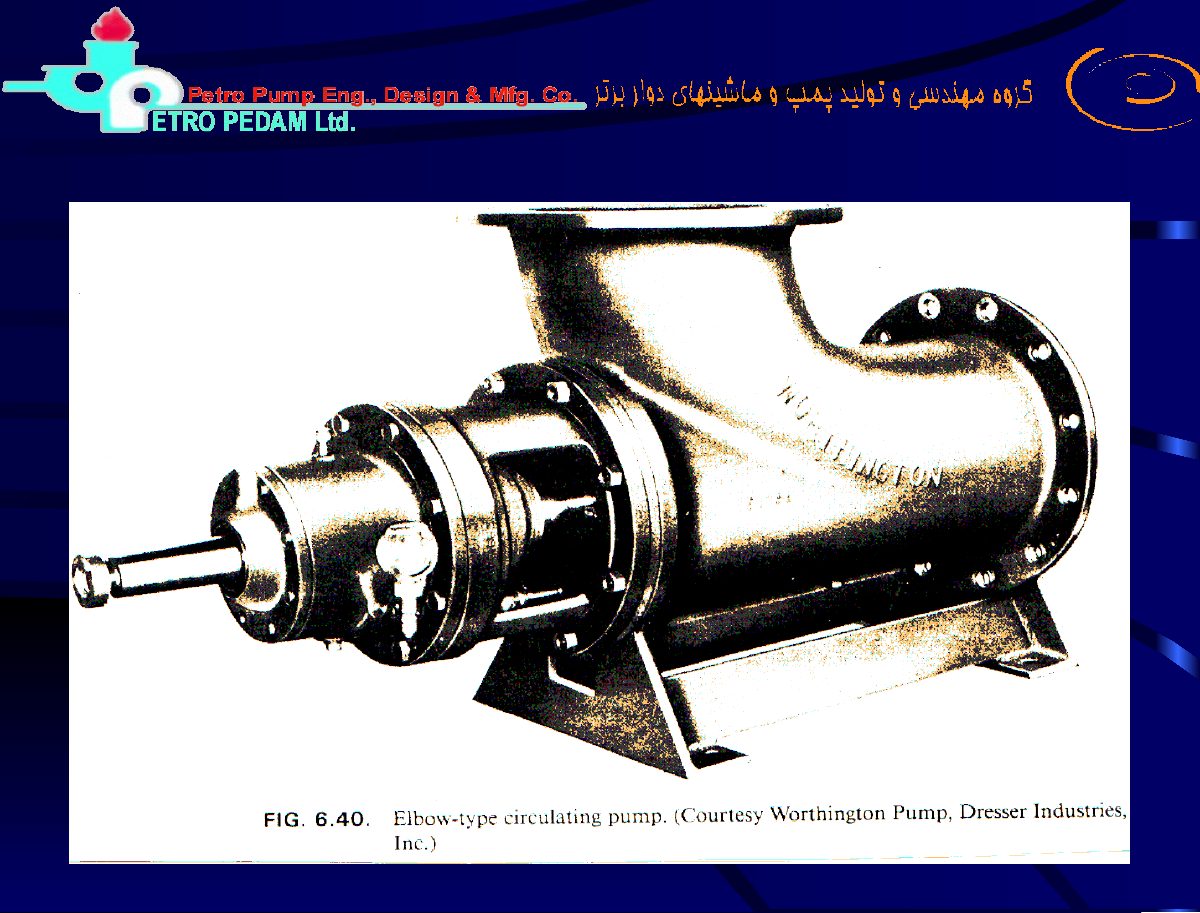
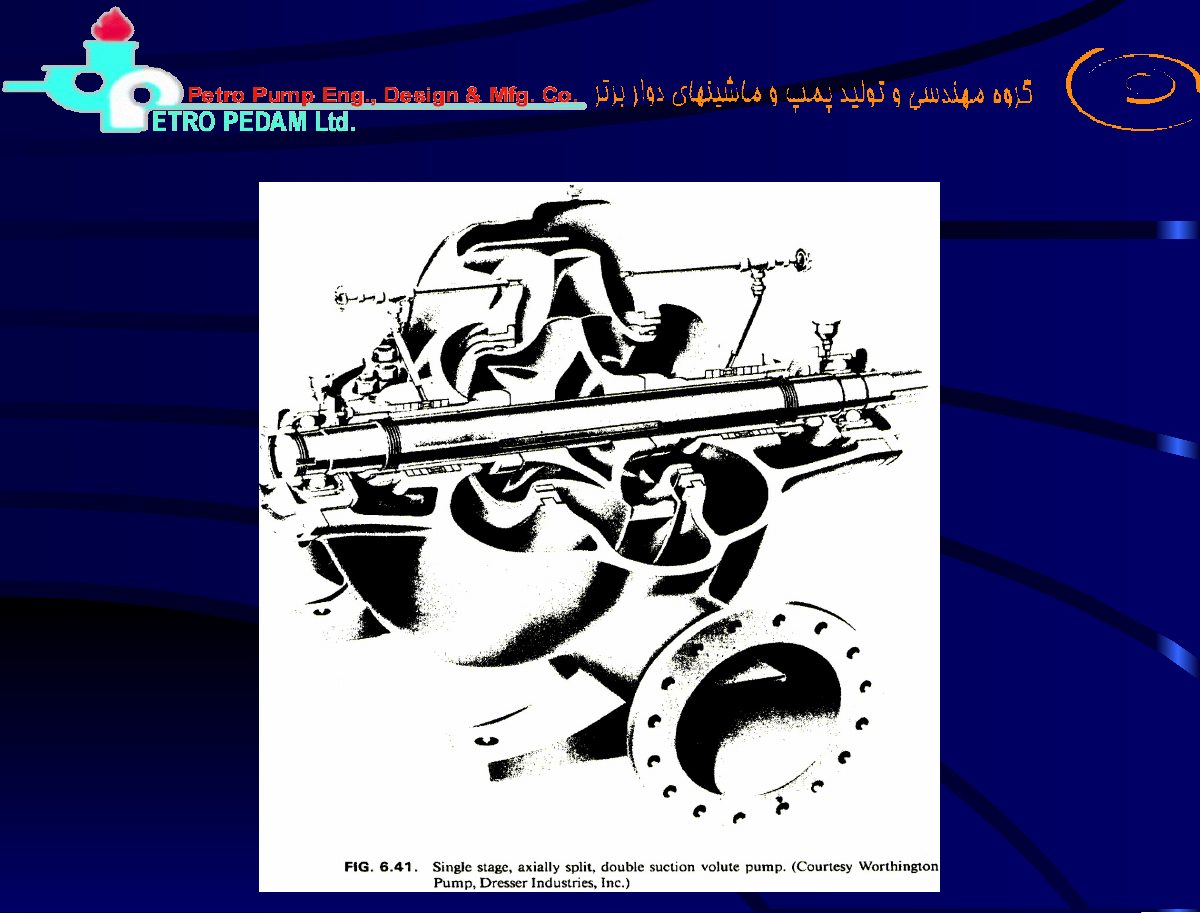
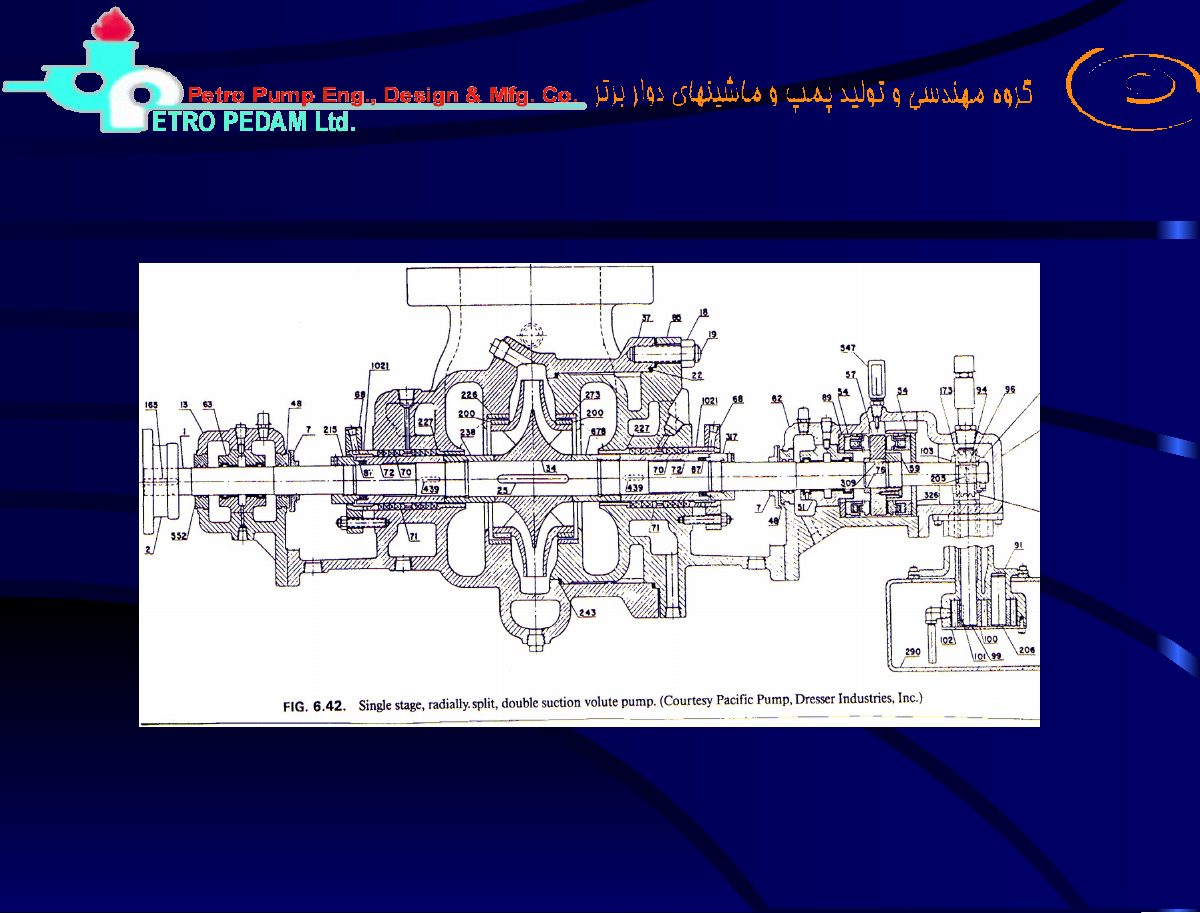
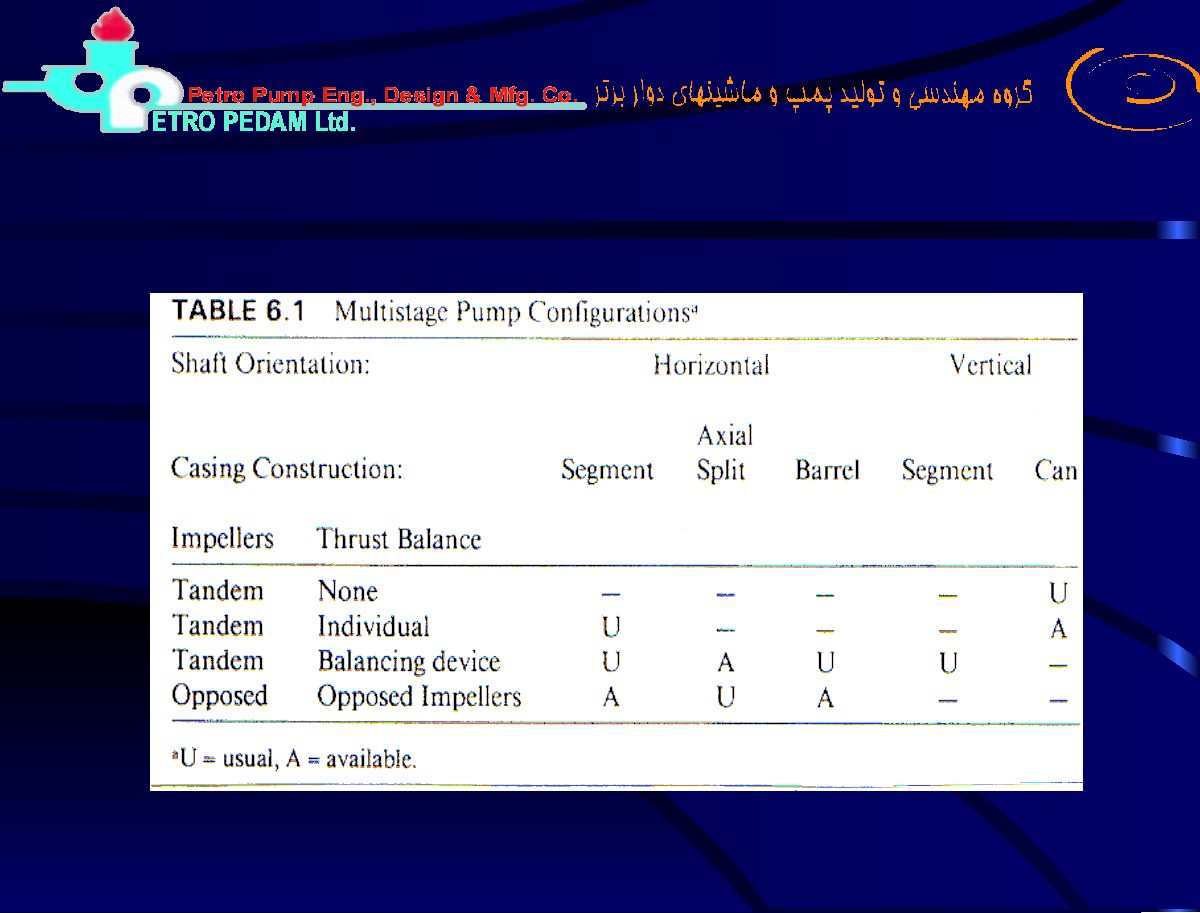
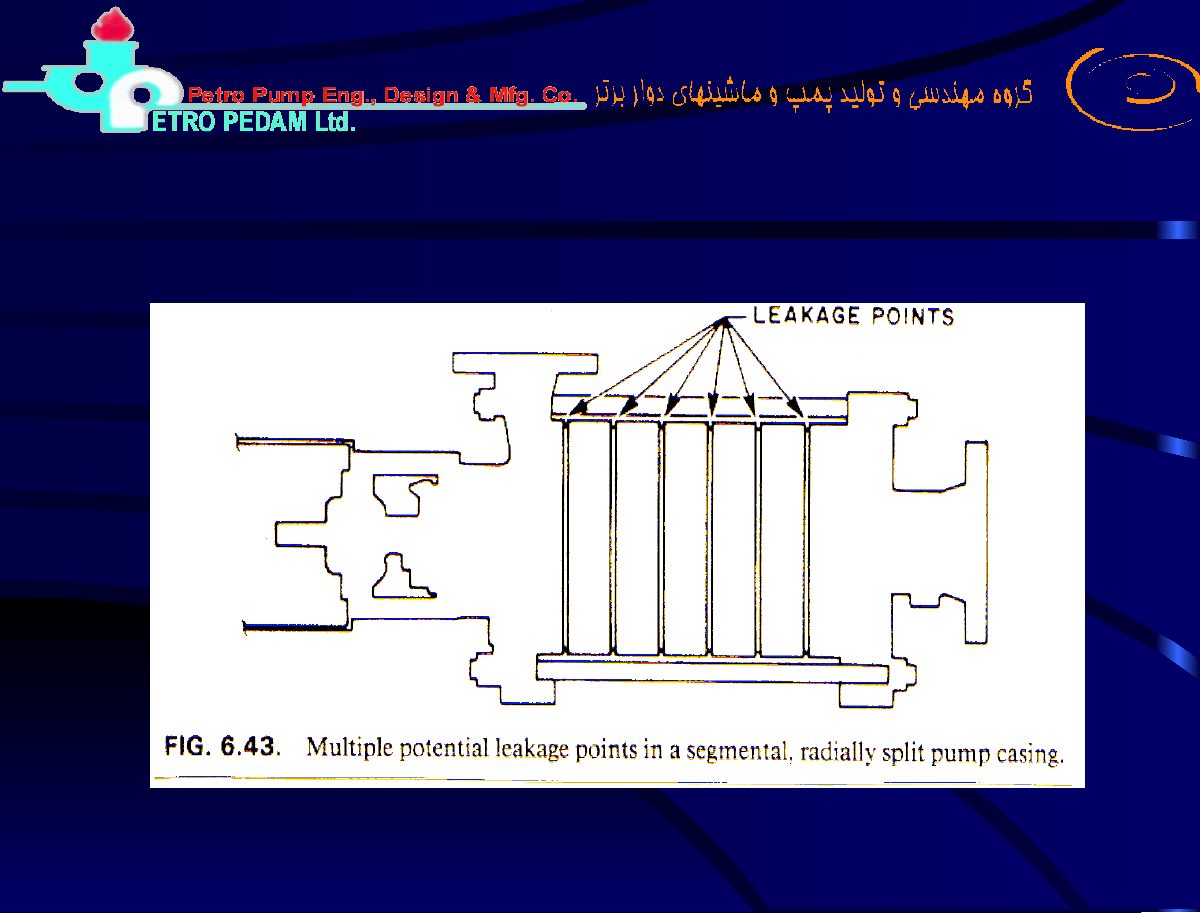
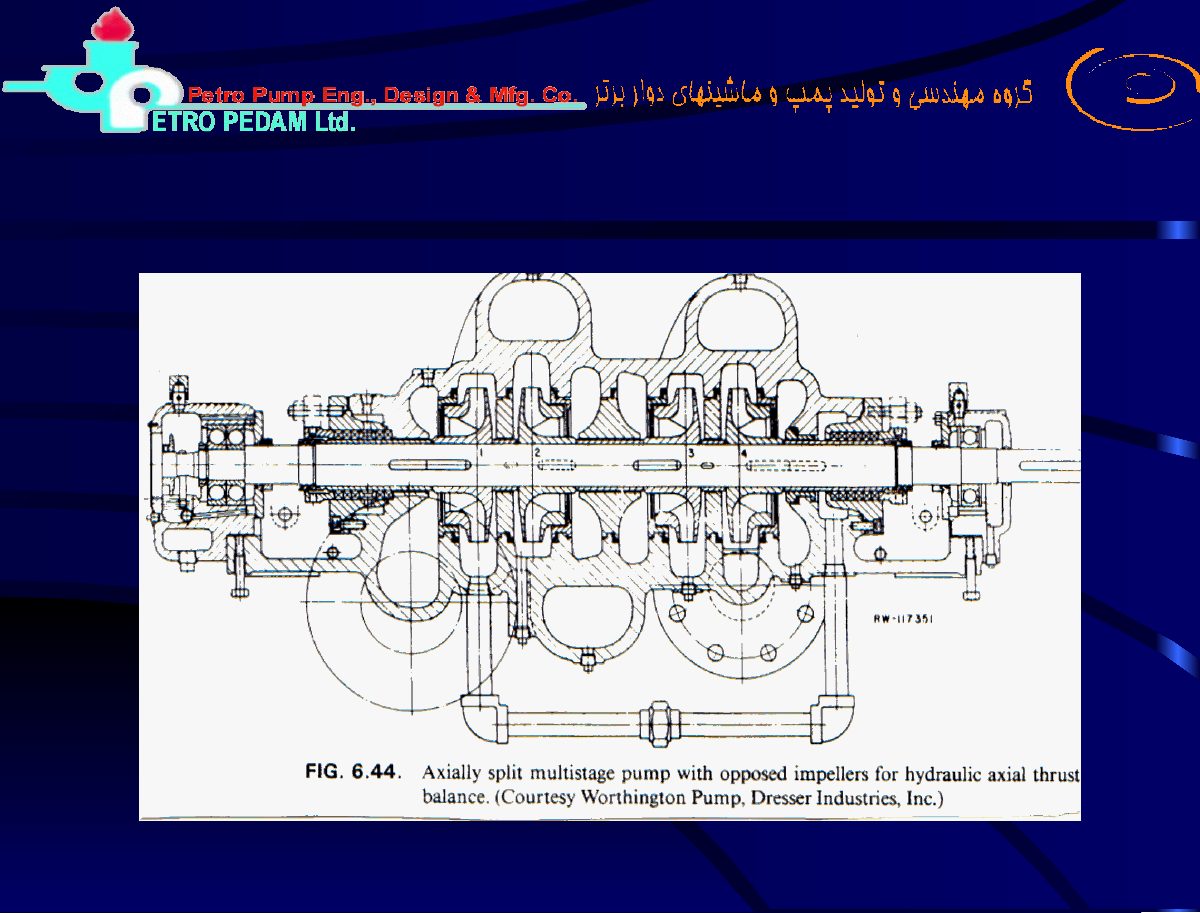
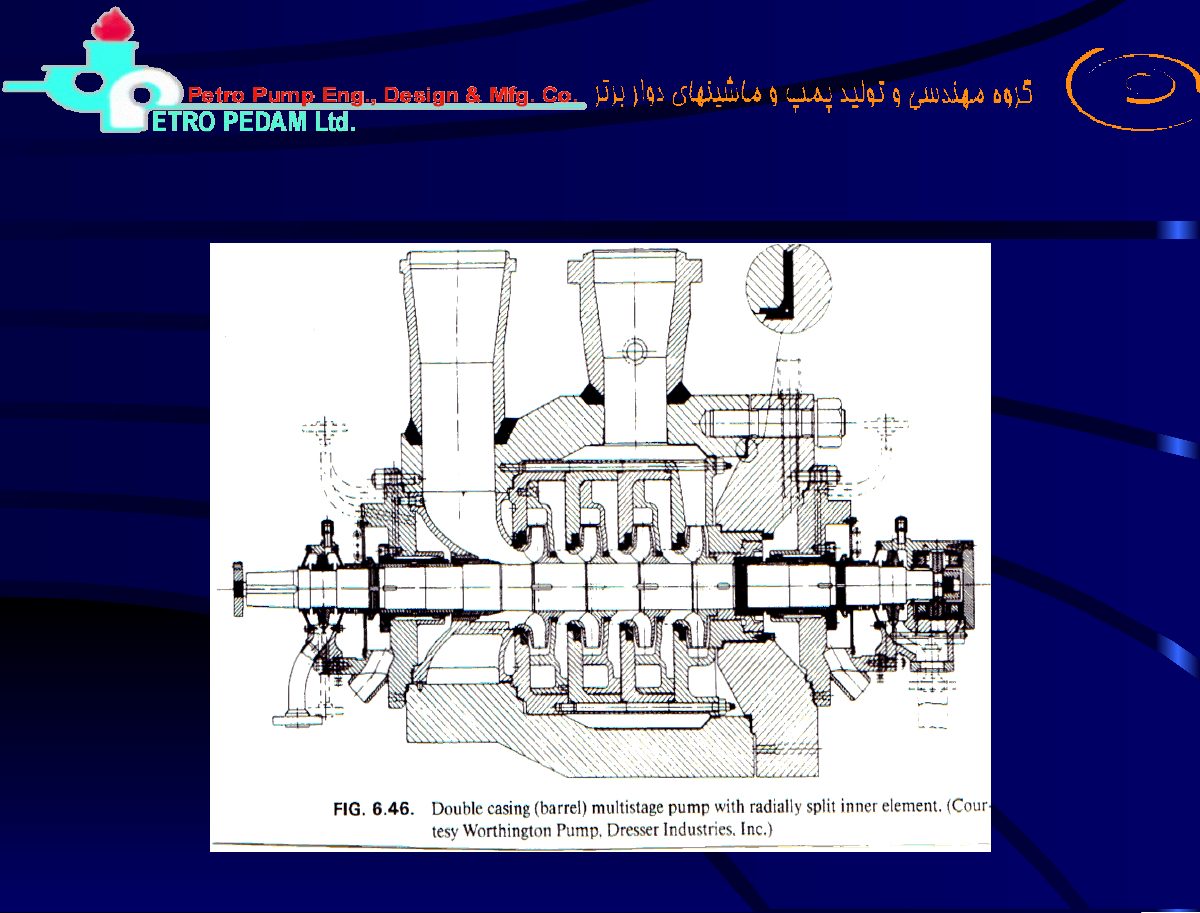
Original pages 109–120
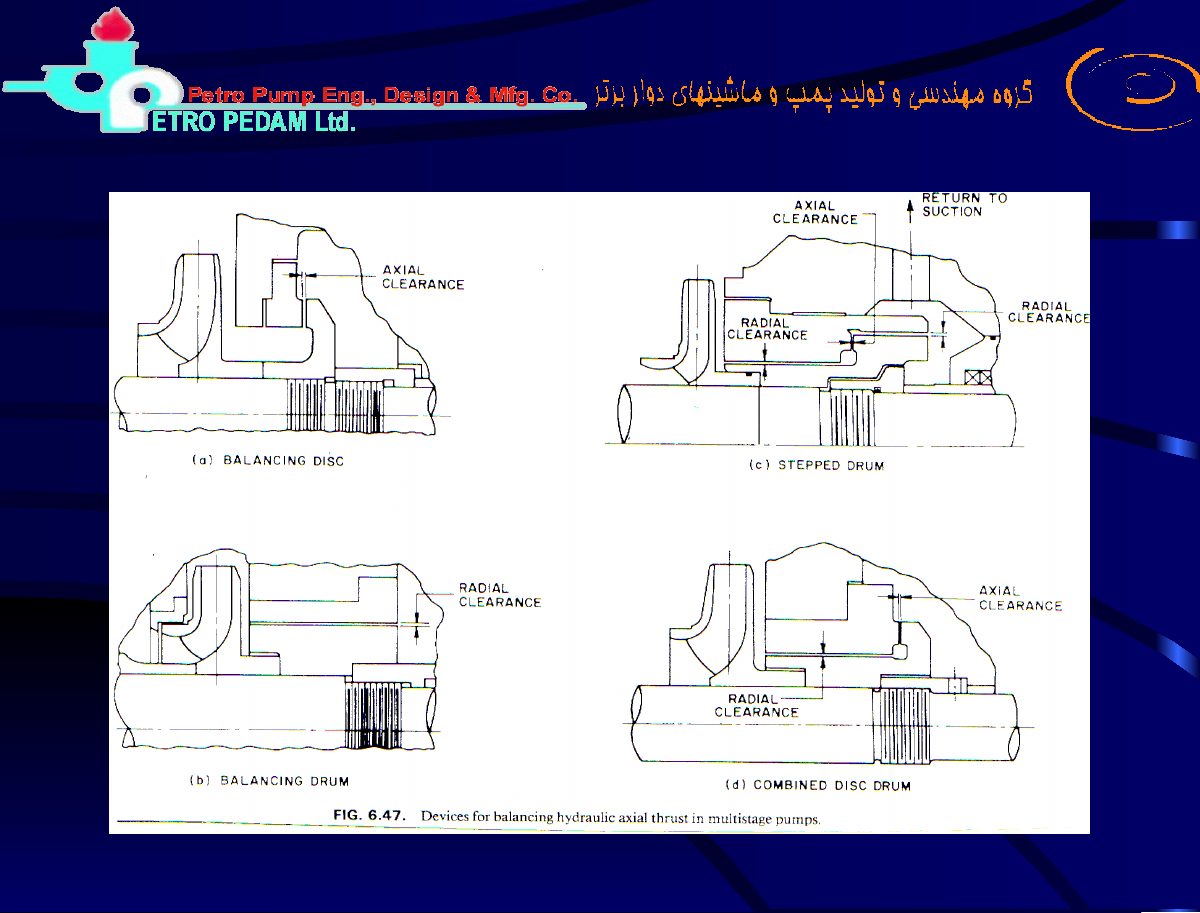
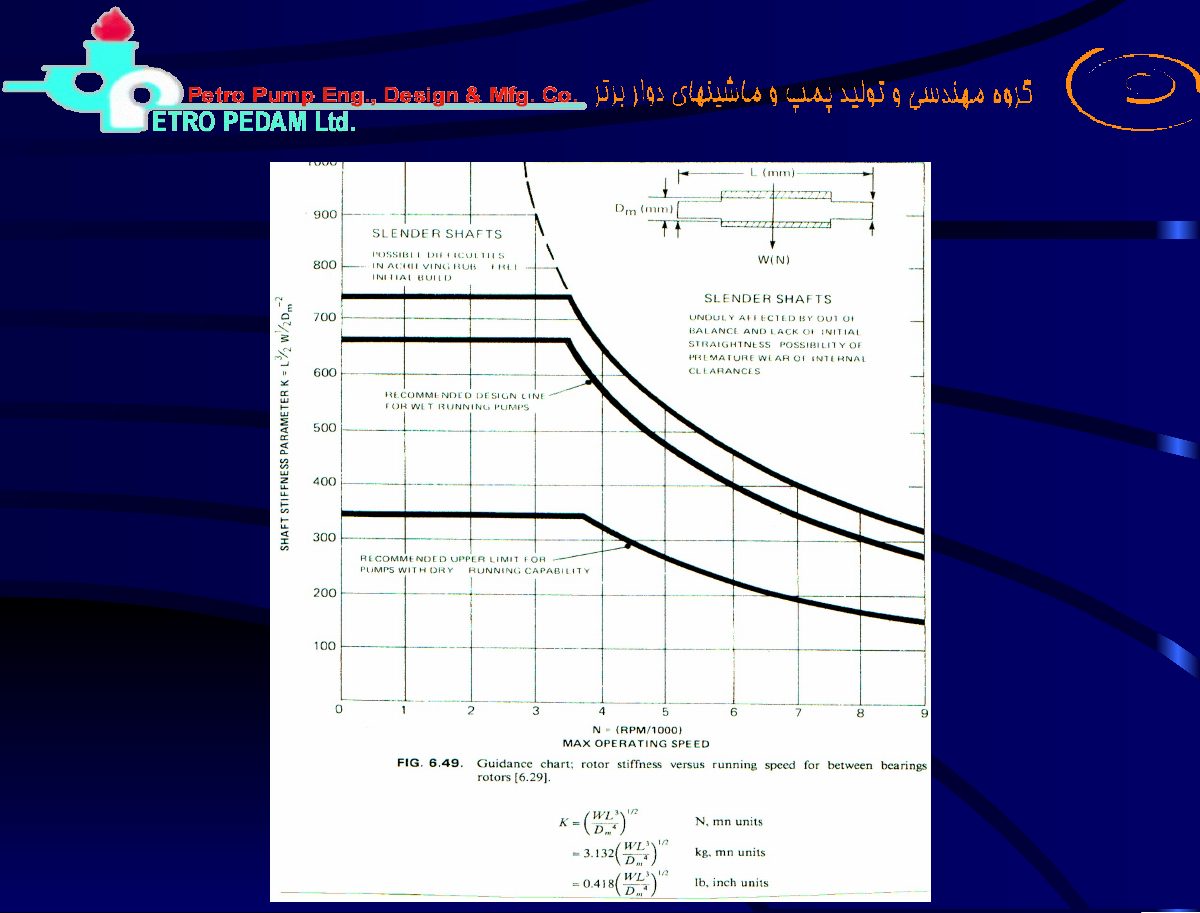
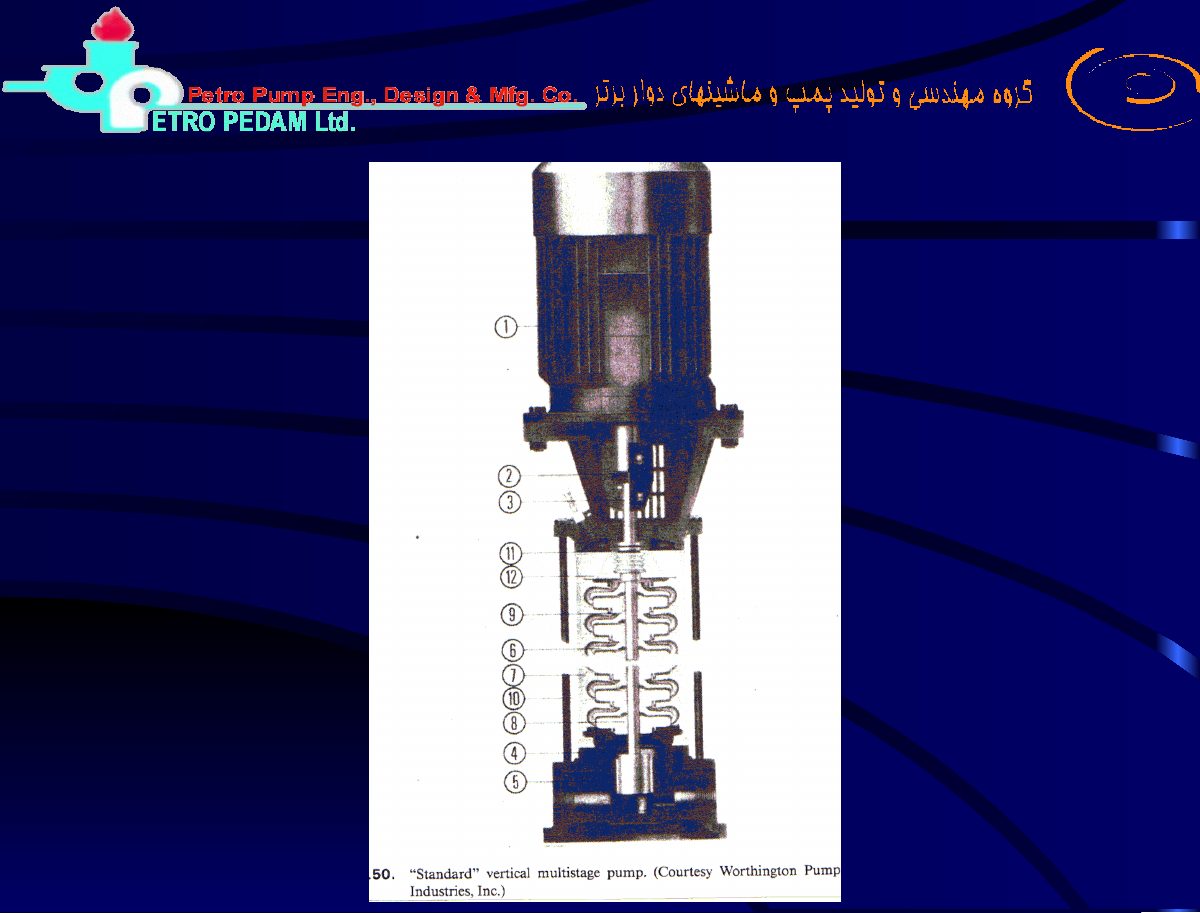
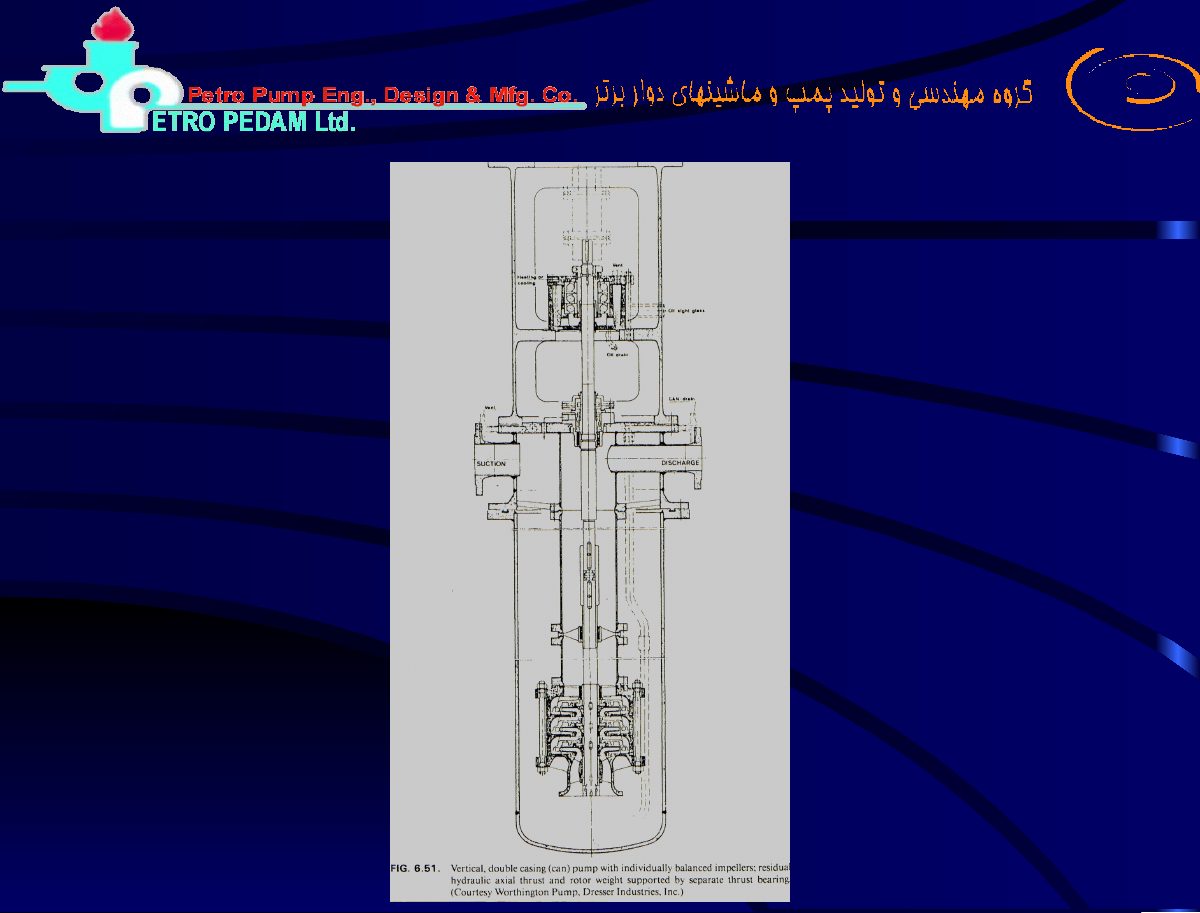
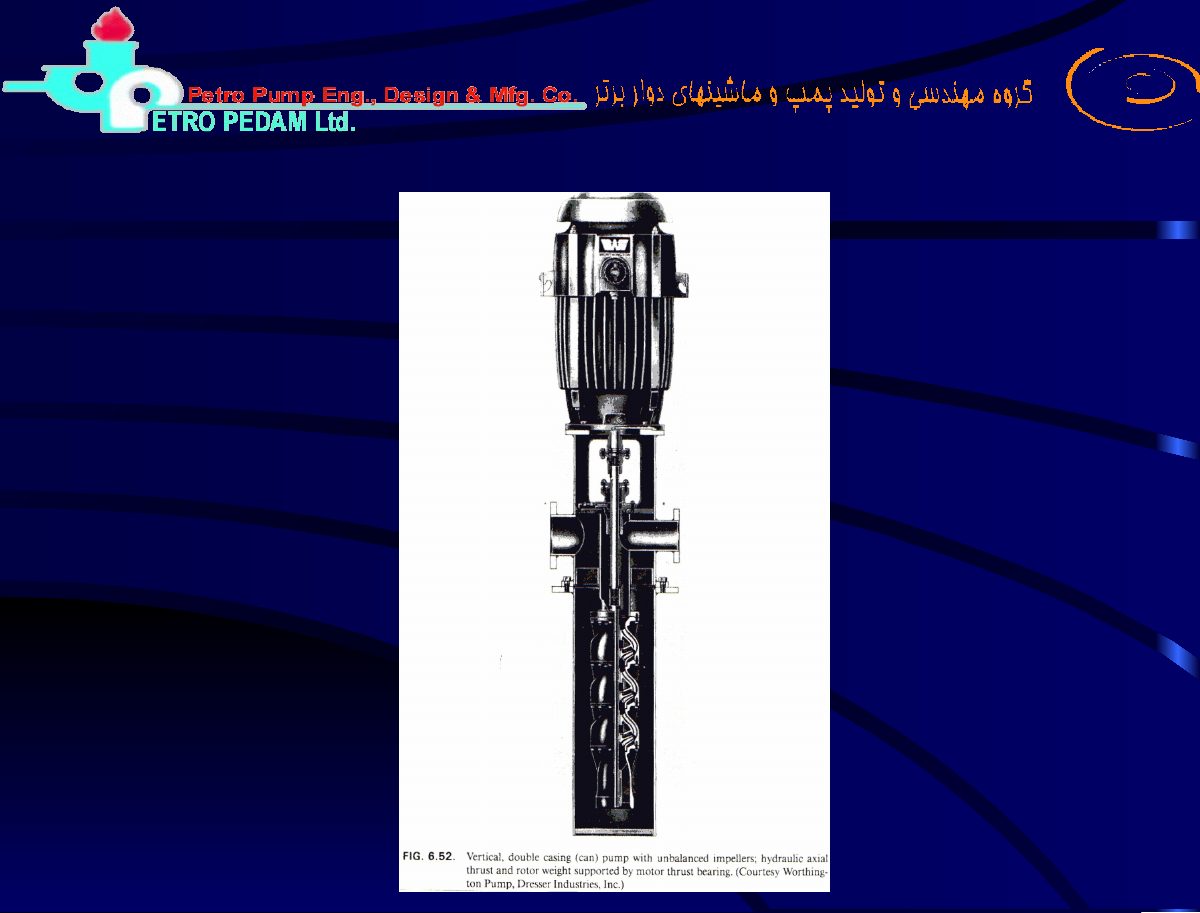
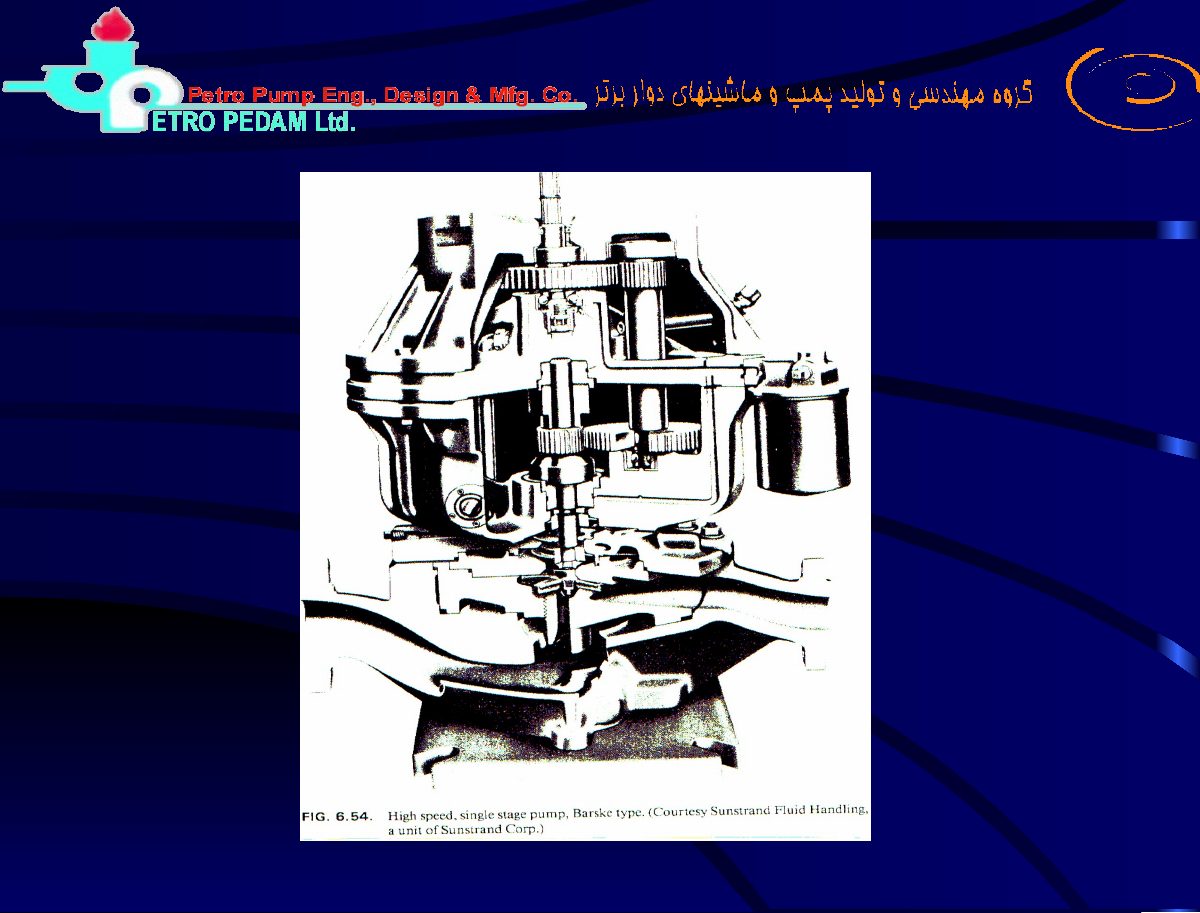
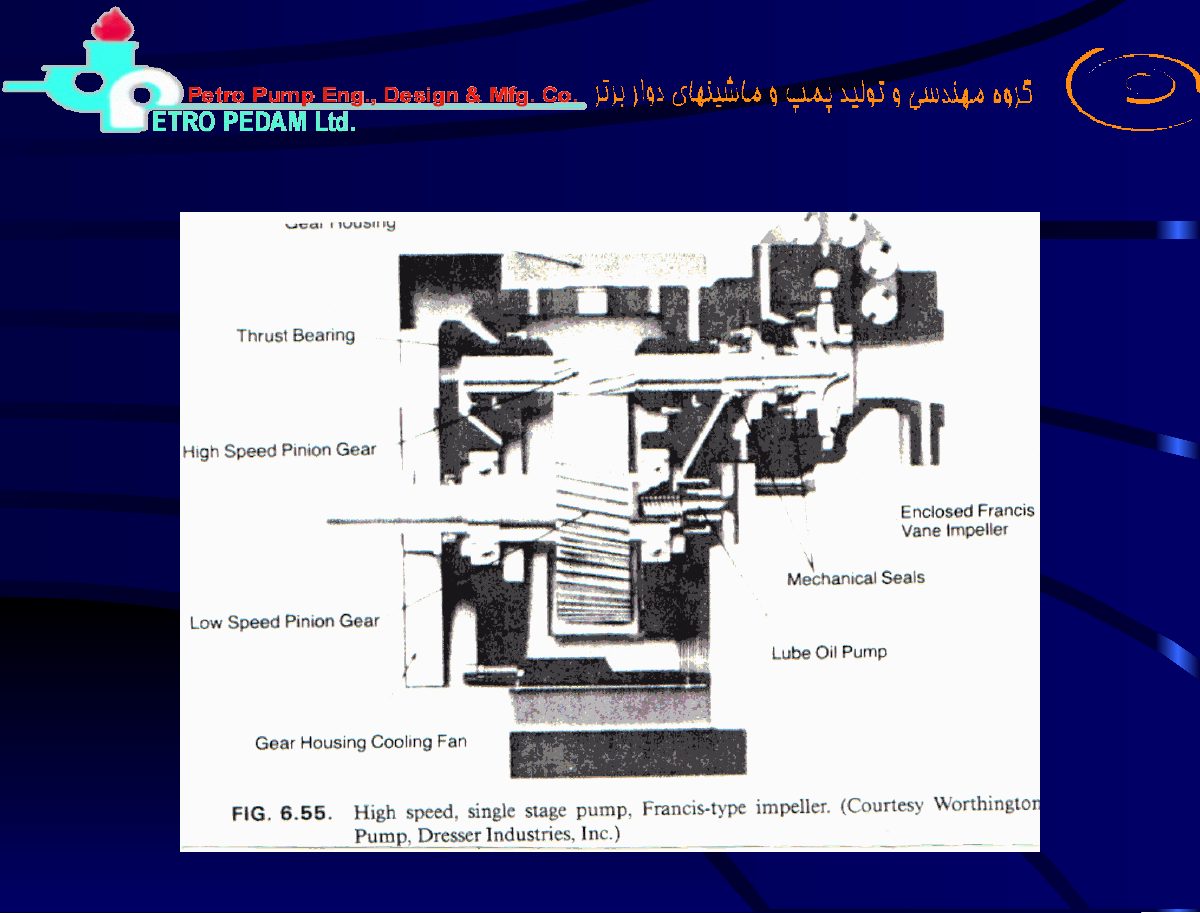
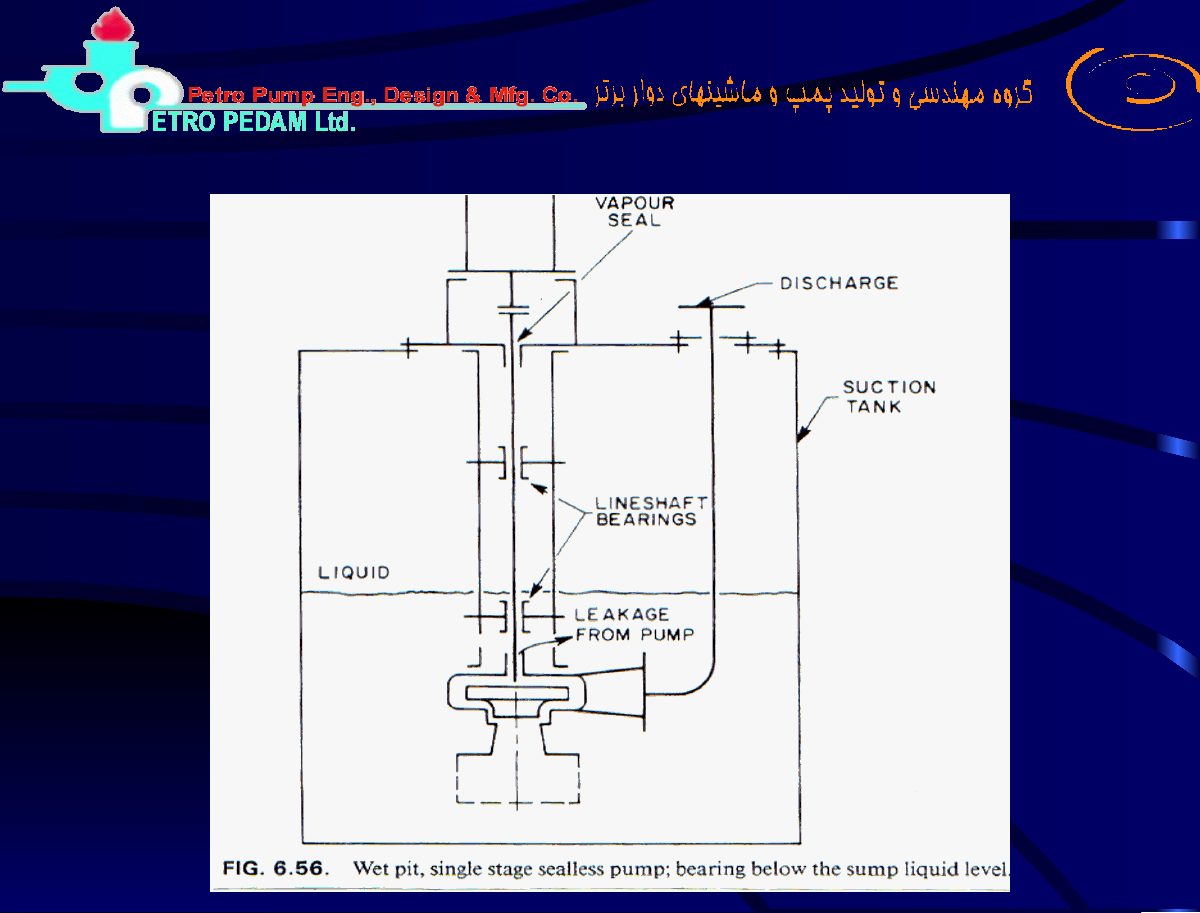
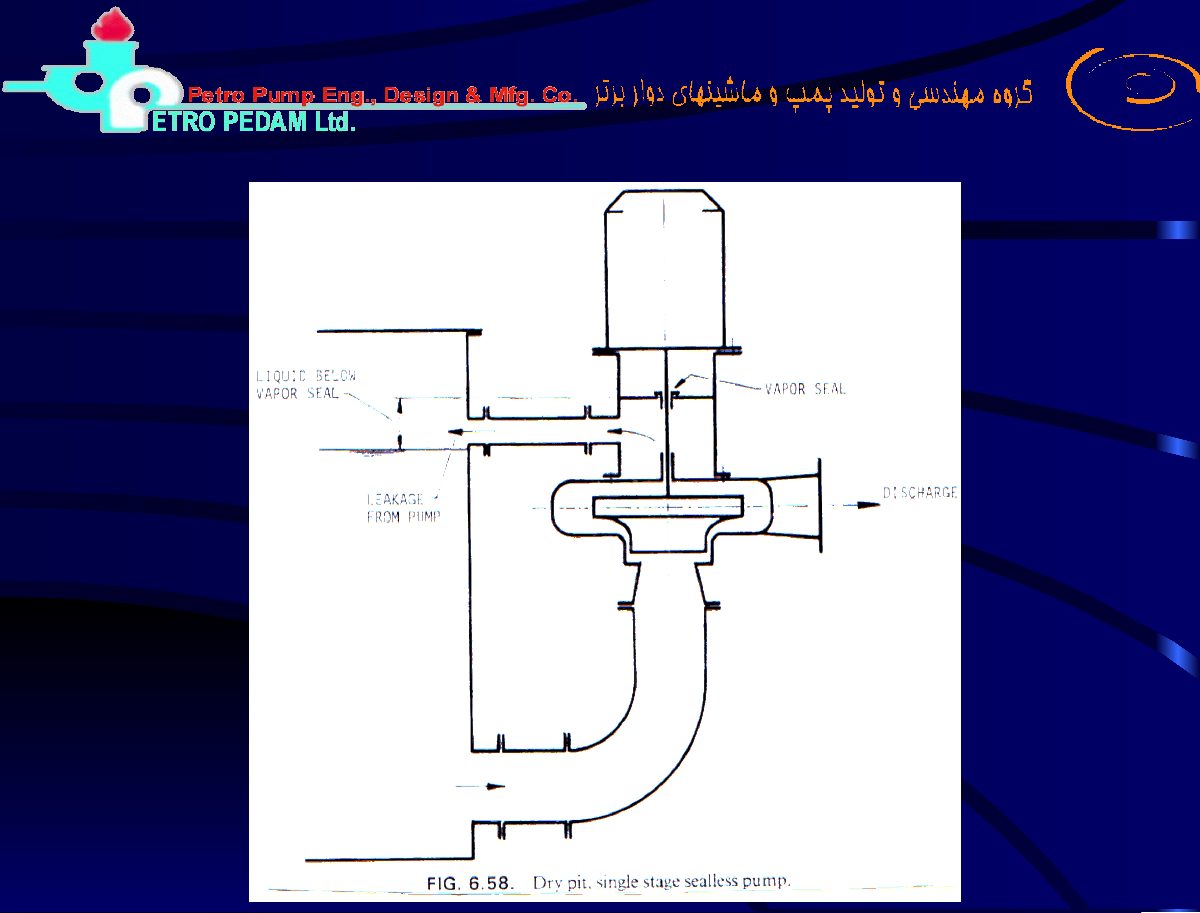
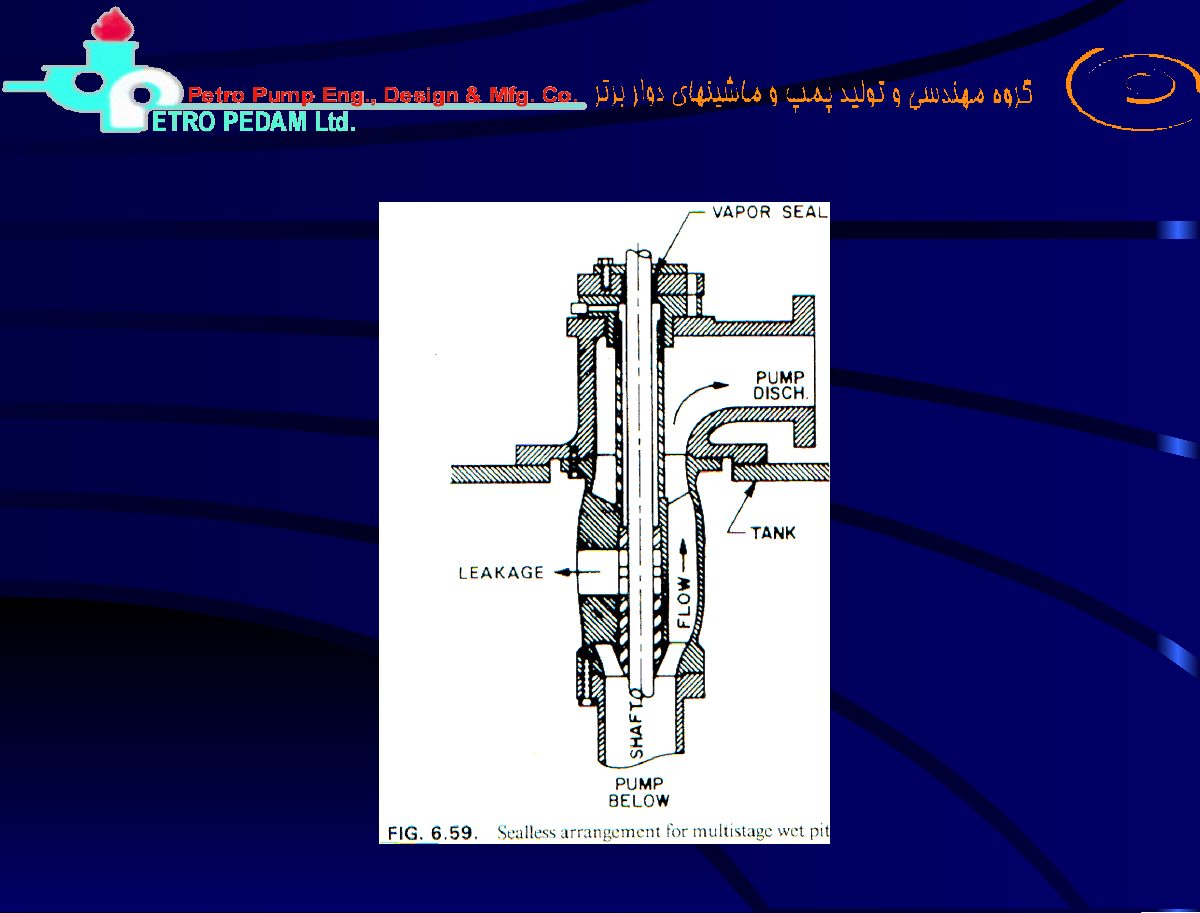
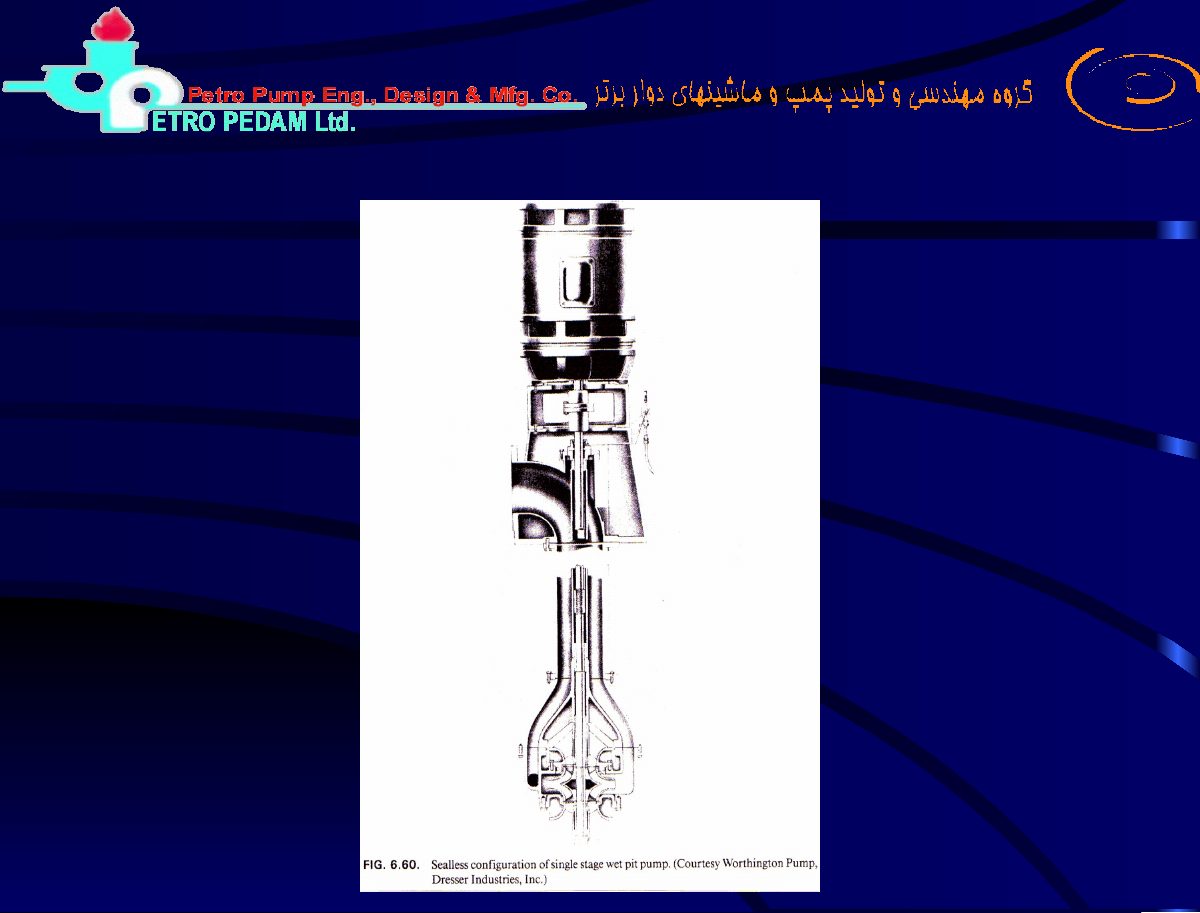
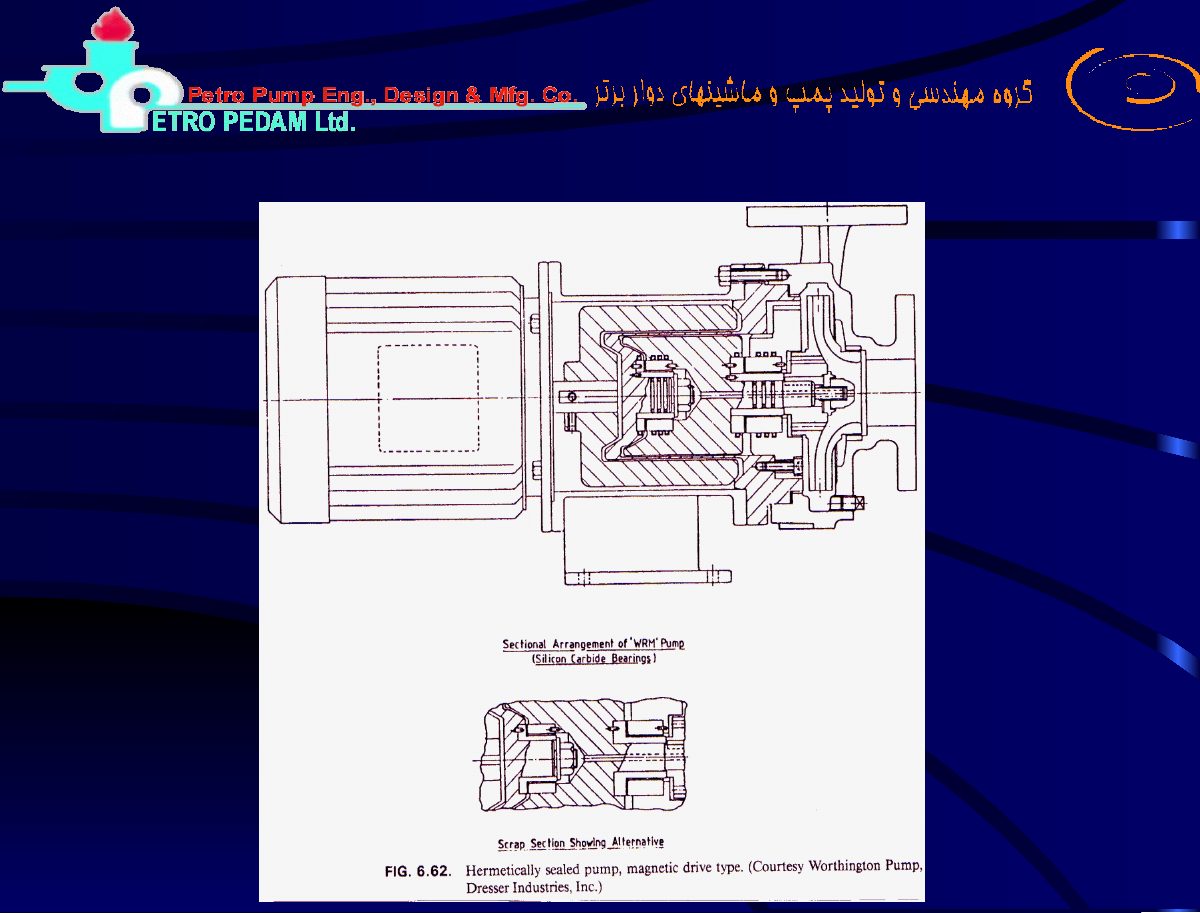
Original pages 121–132
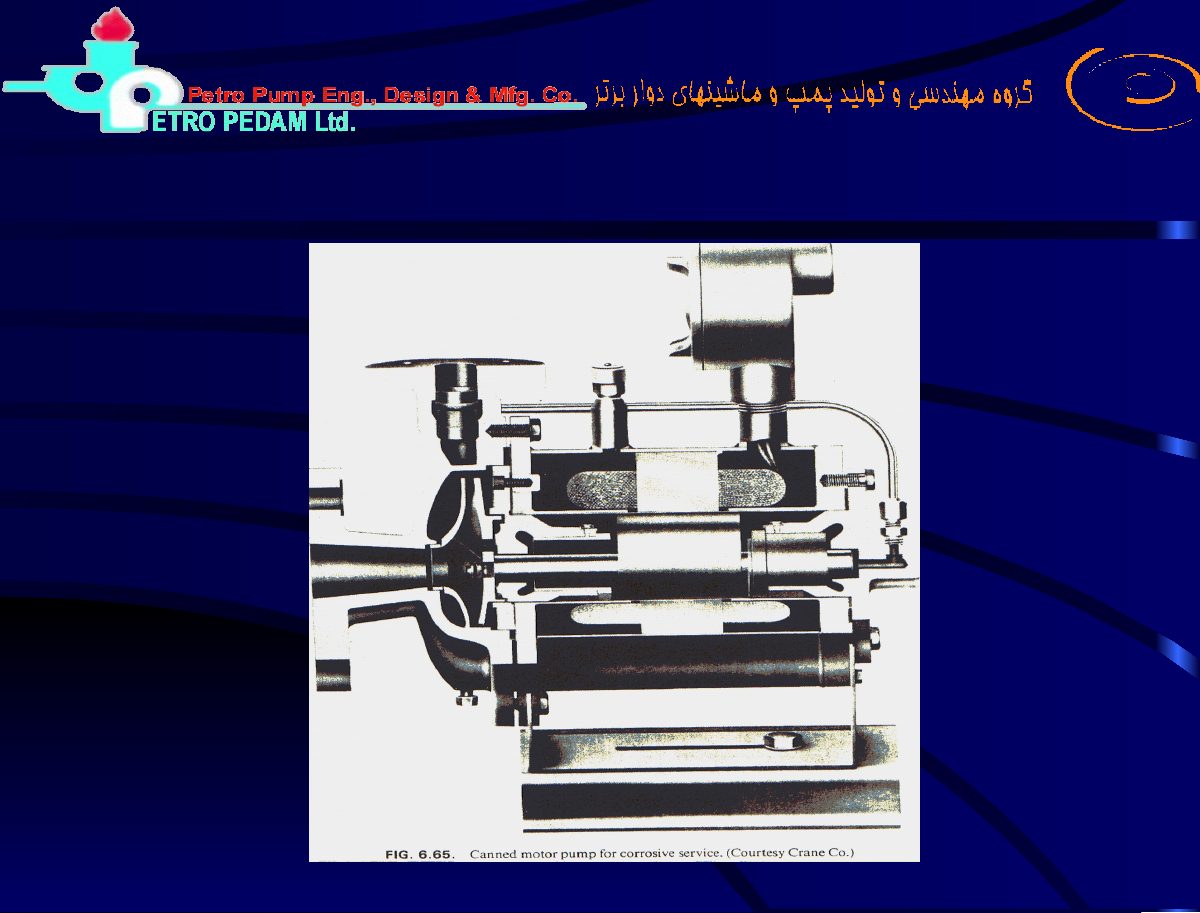
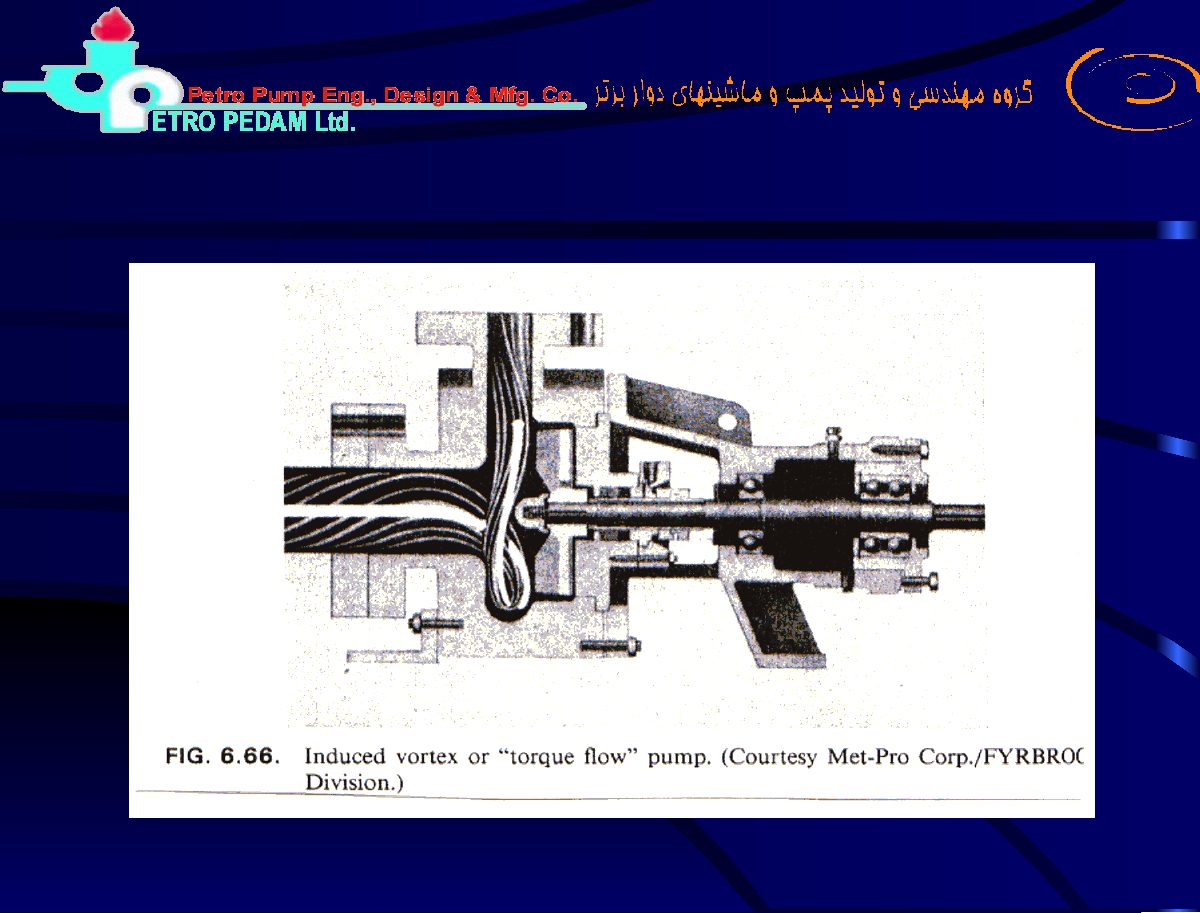
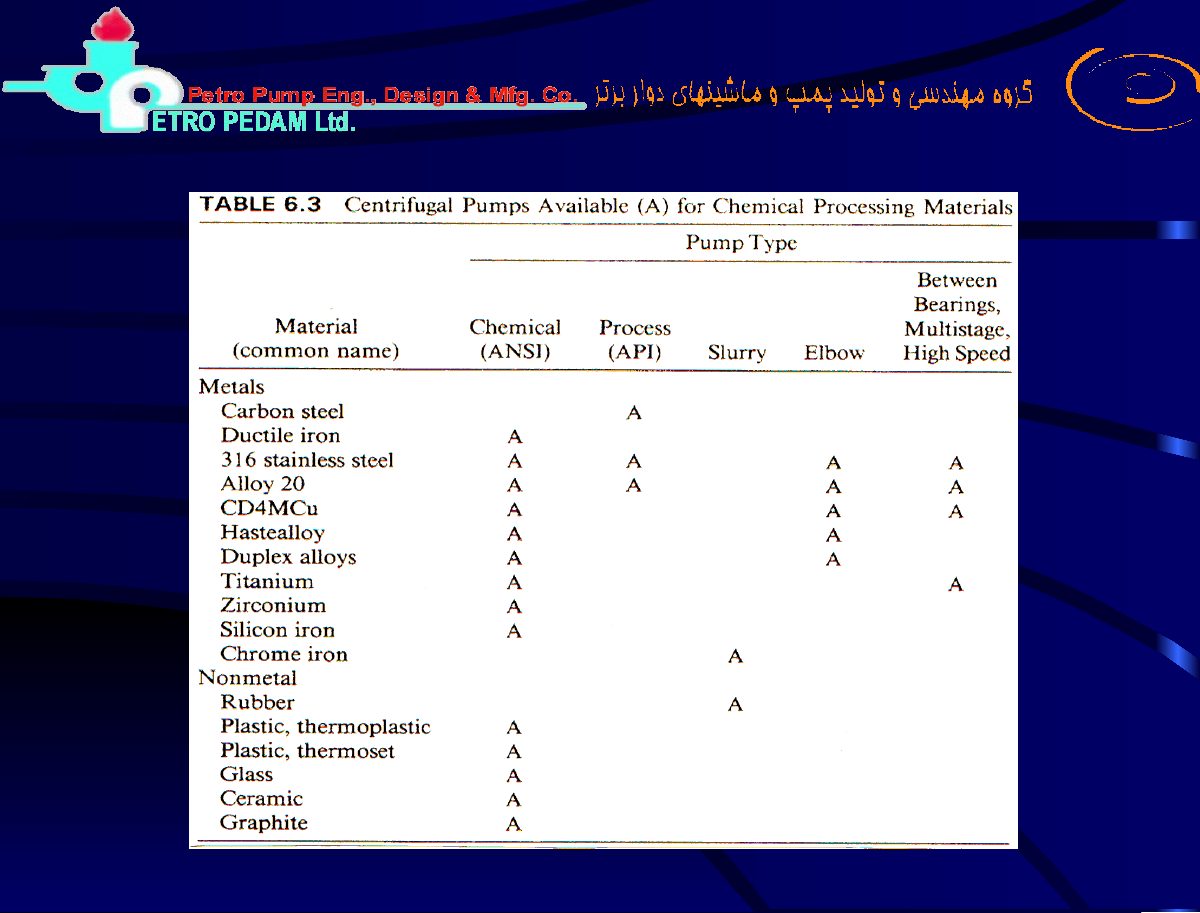
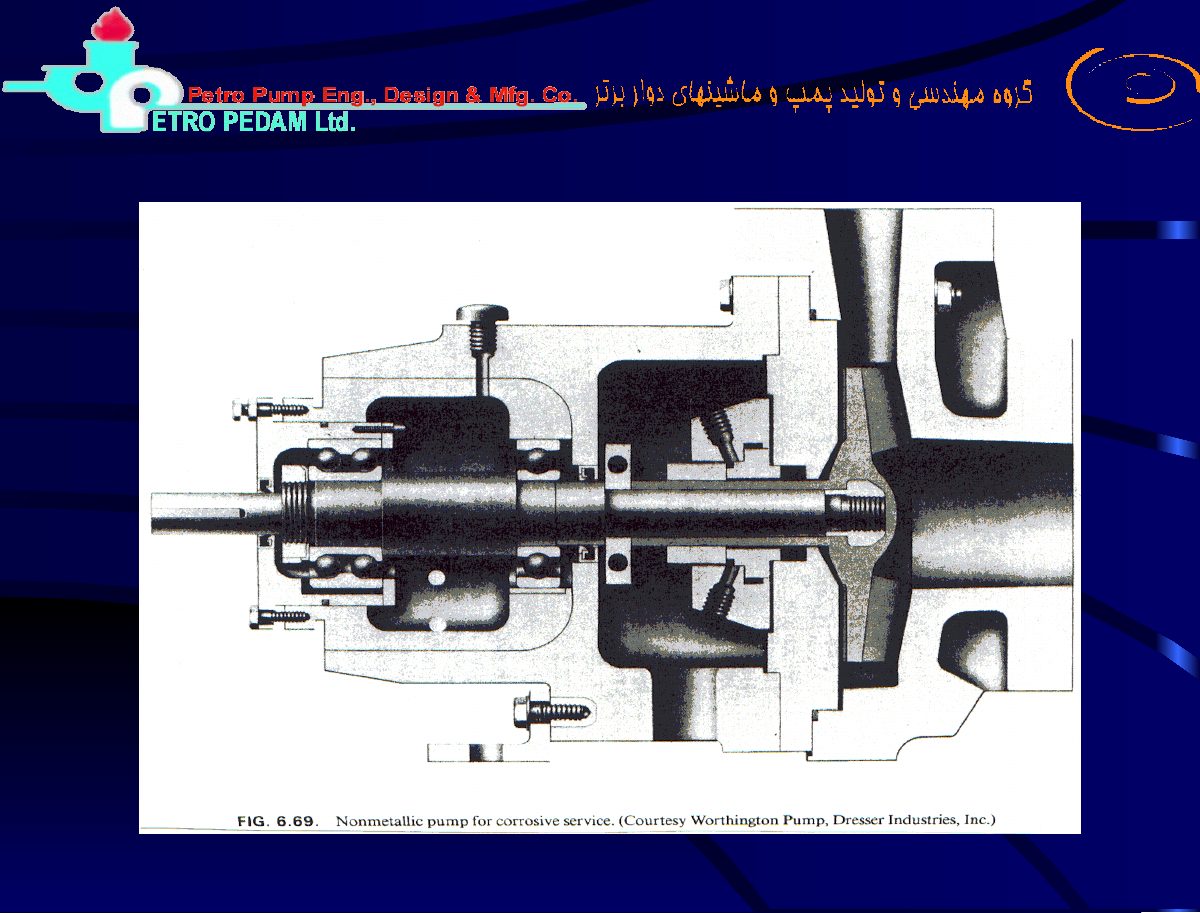
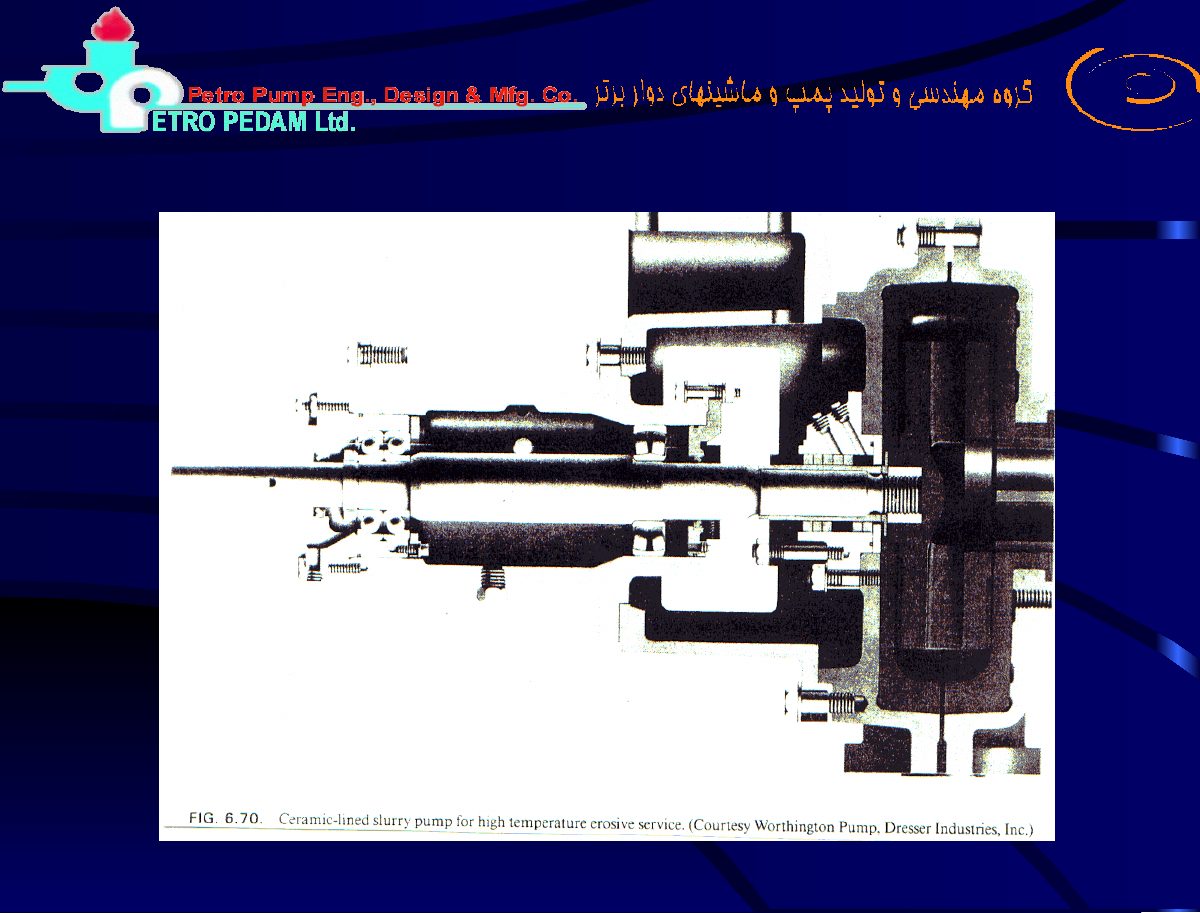
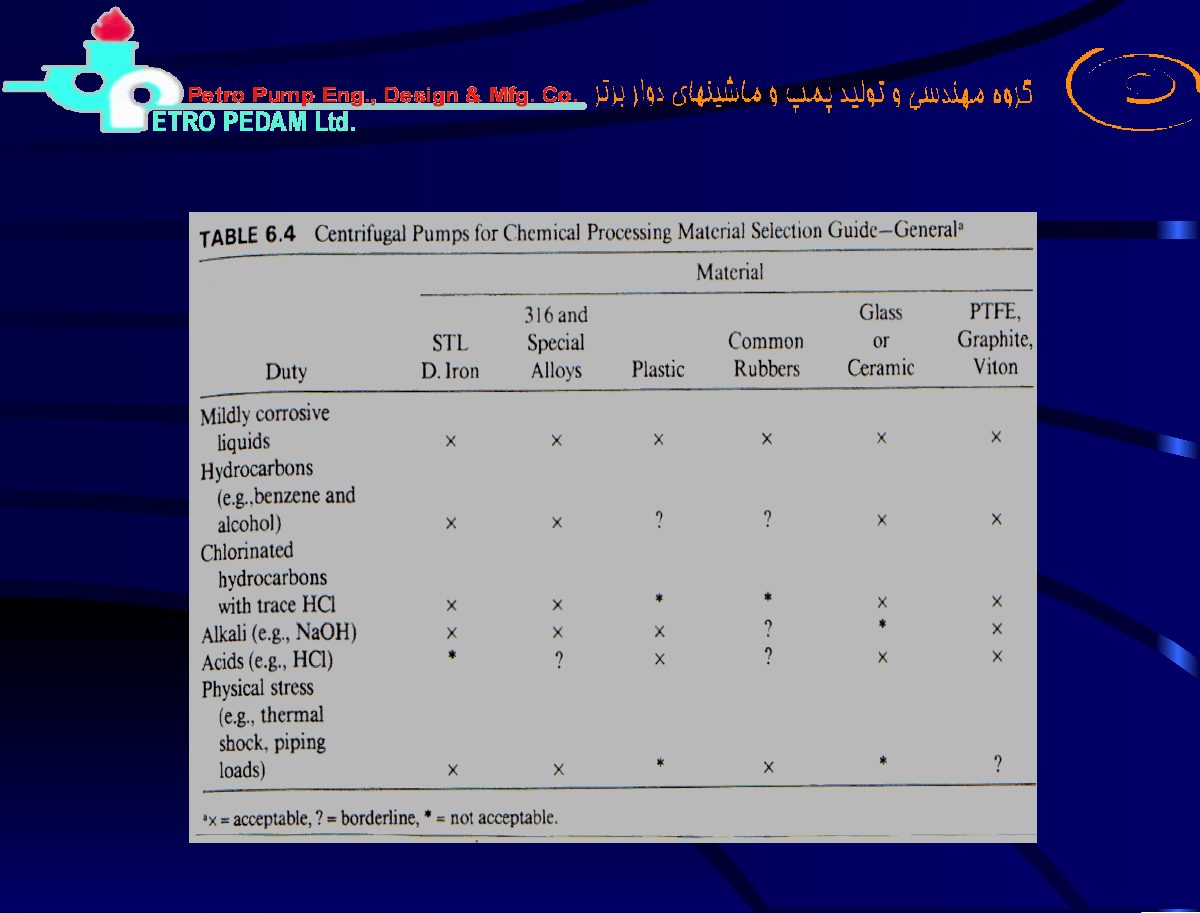
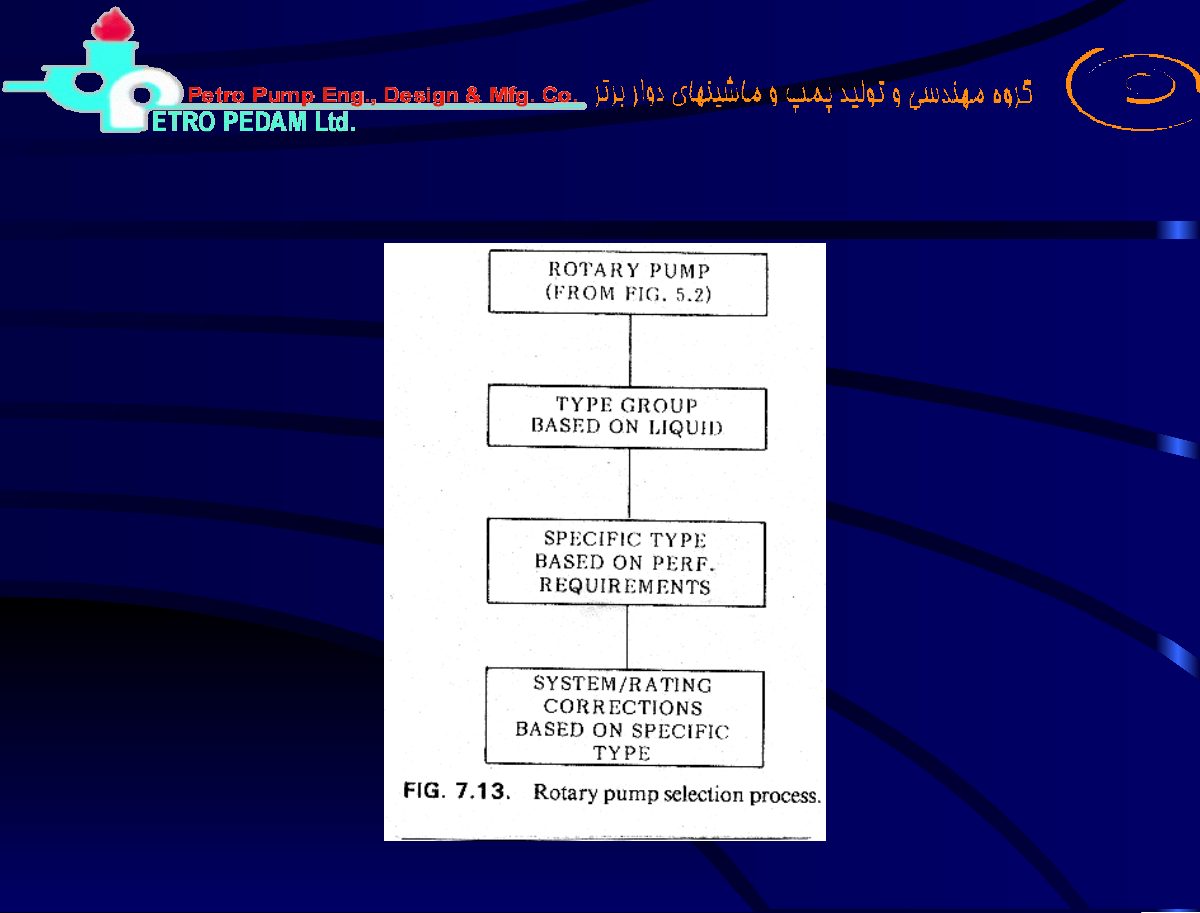
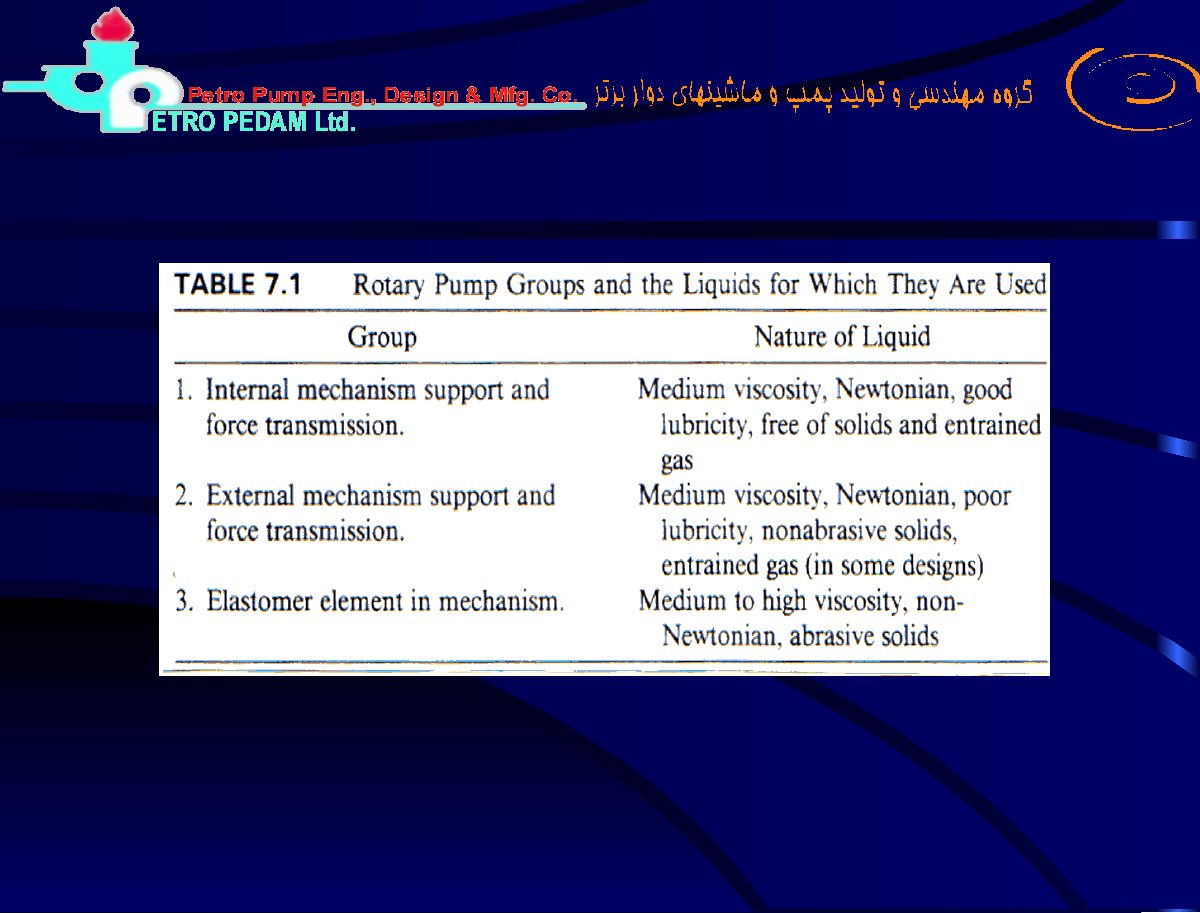
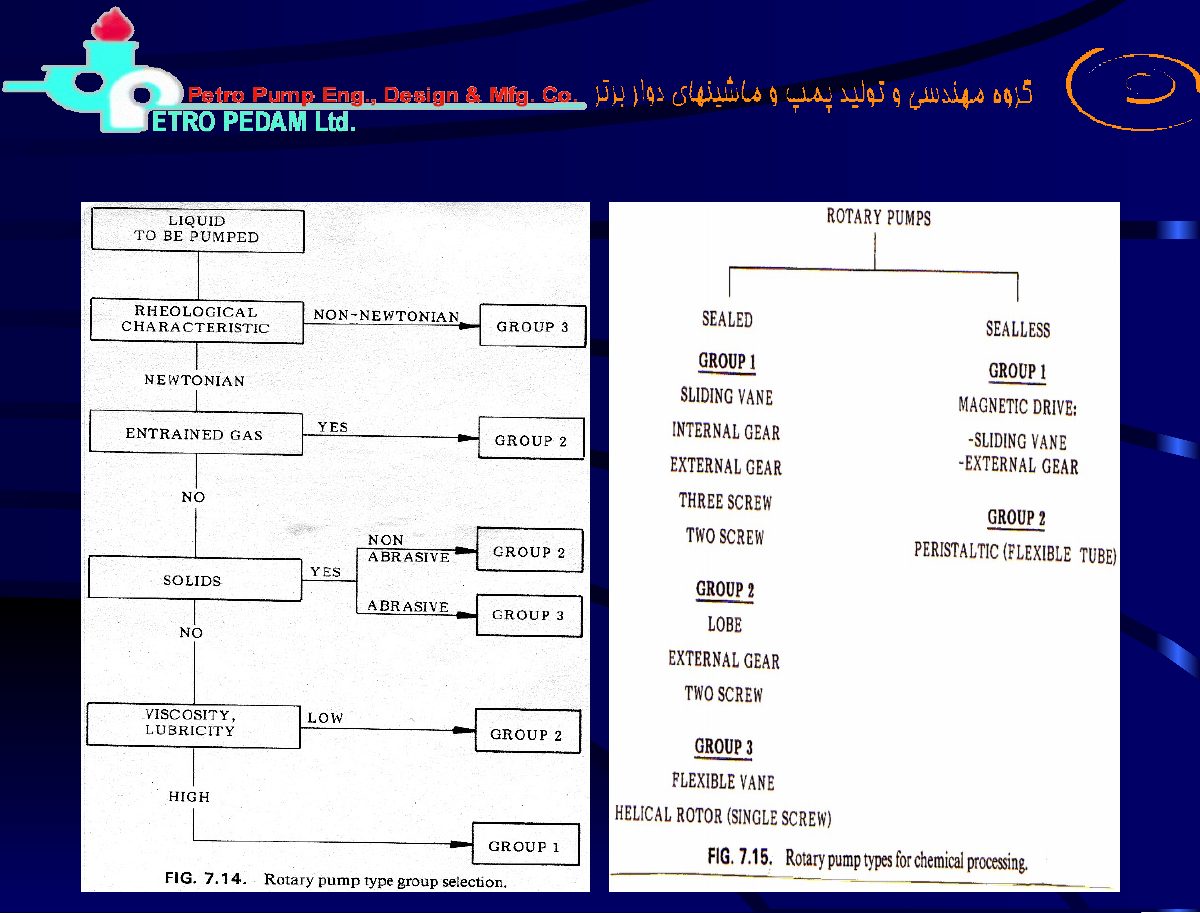
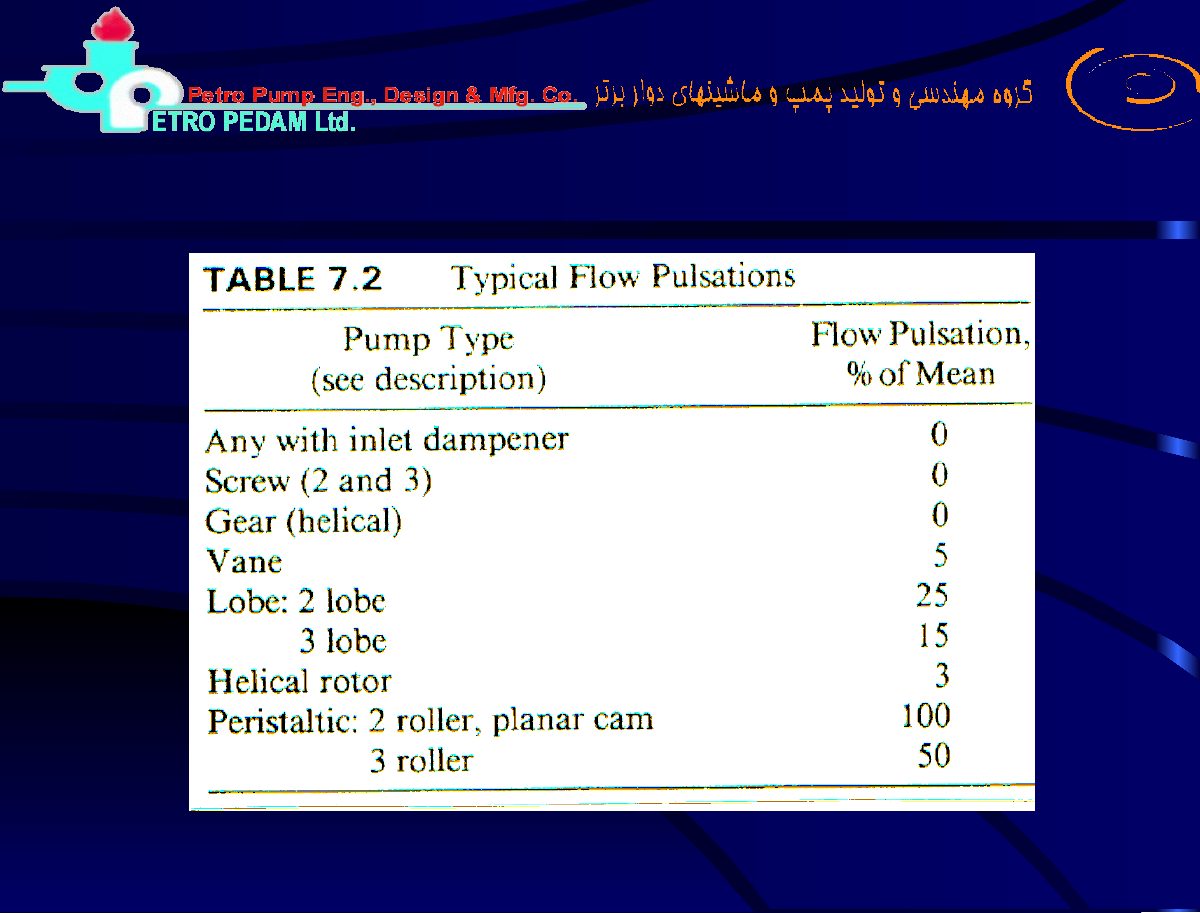
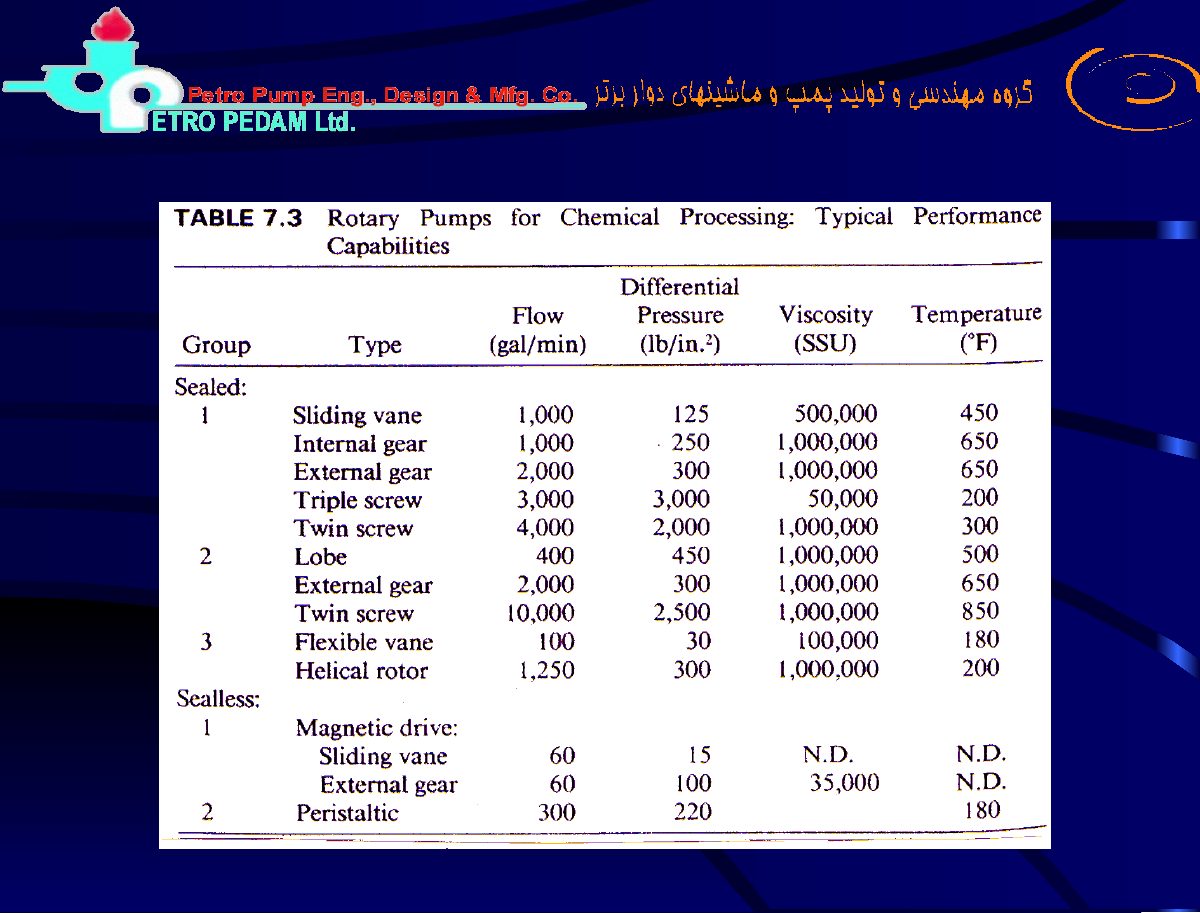
Original pages 133–144
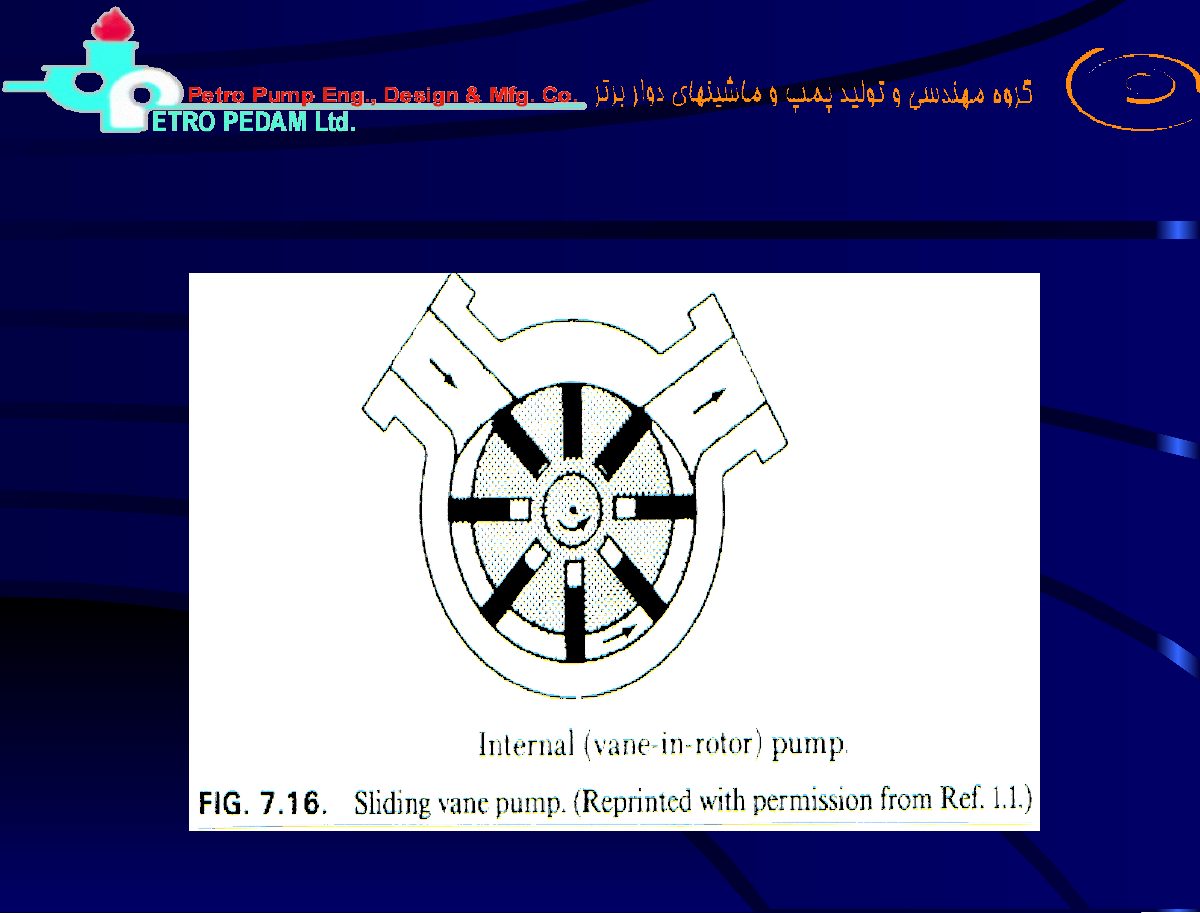
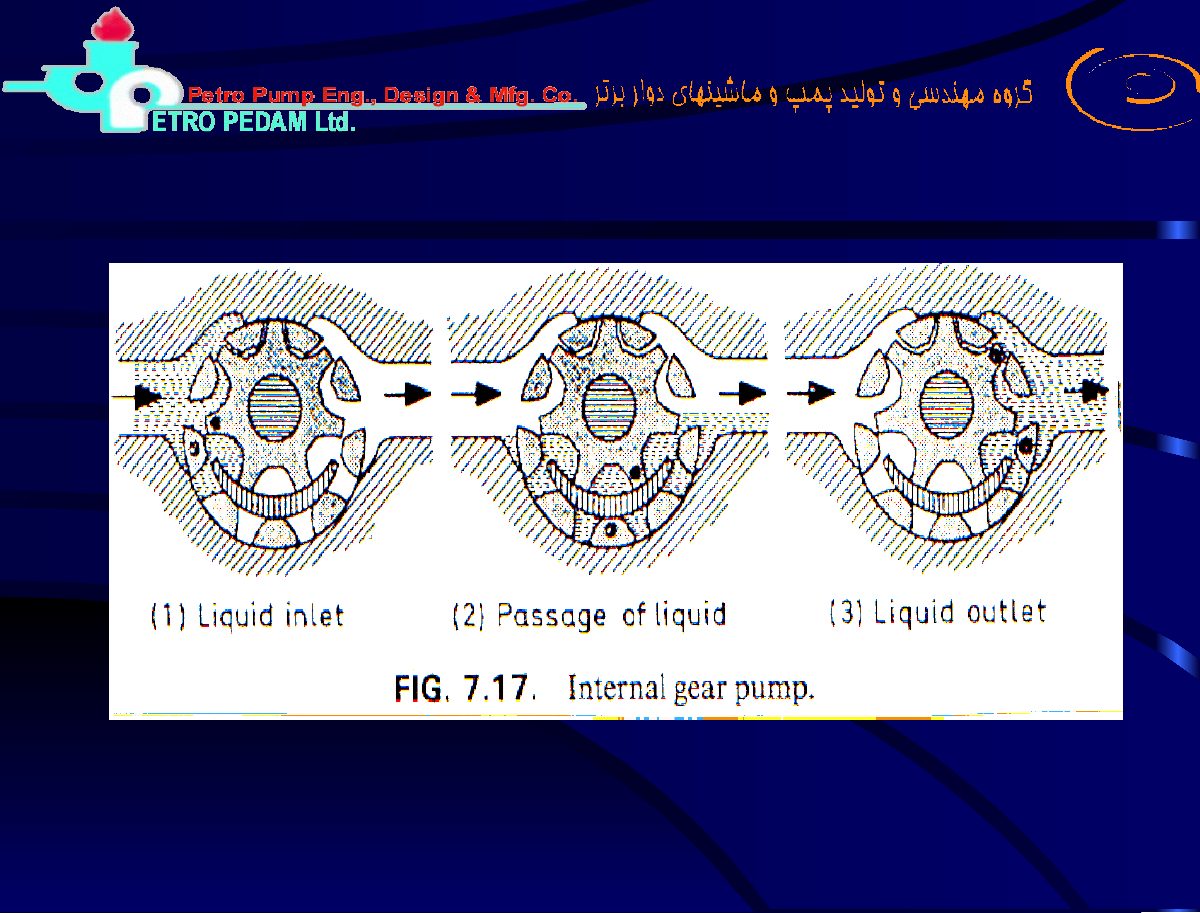
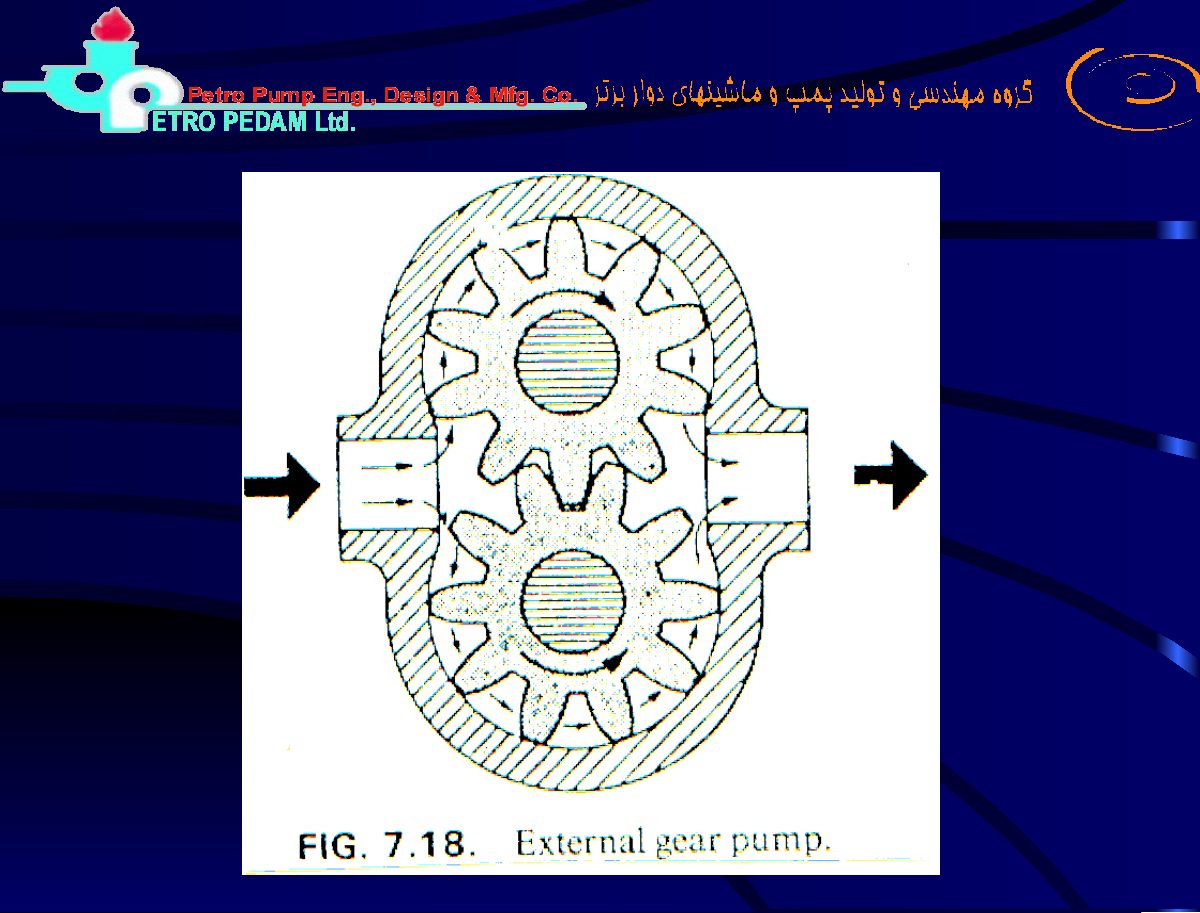
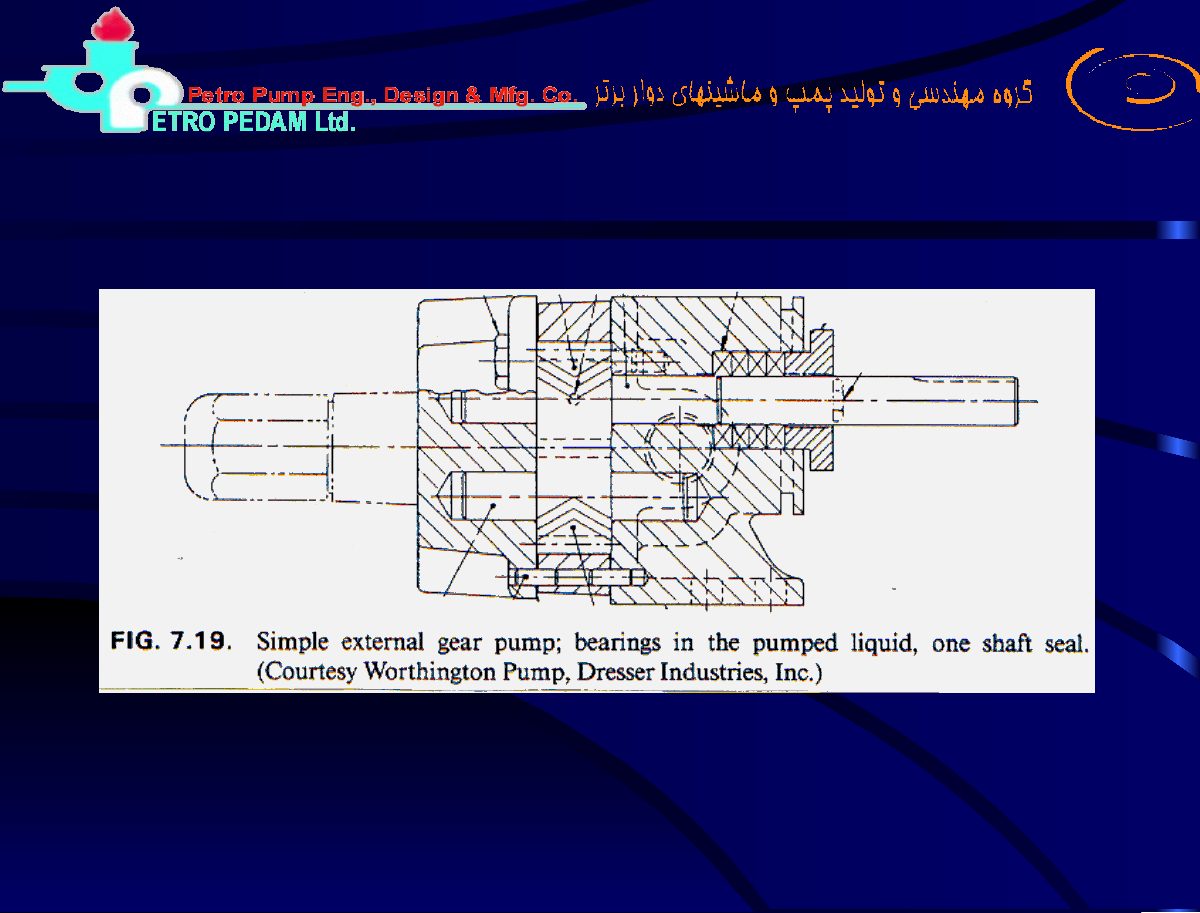
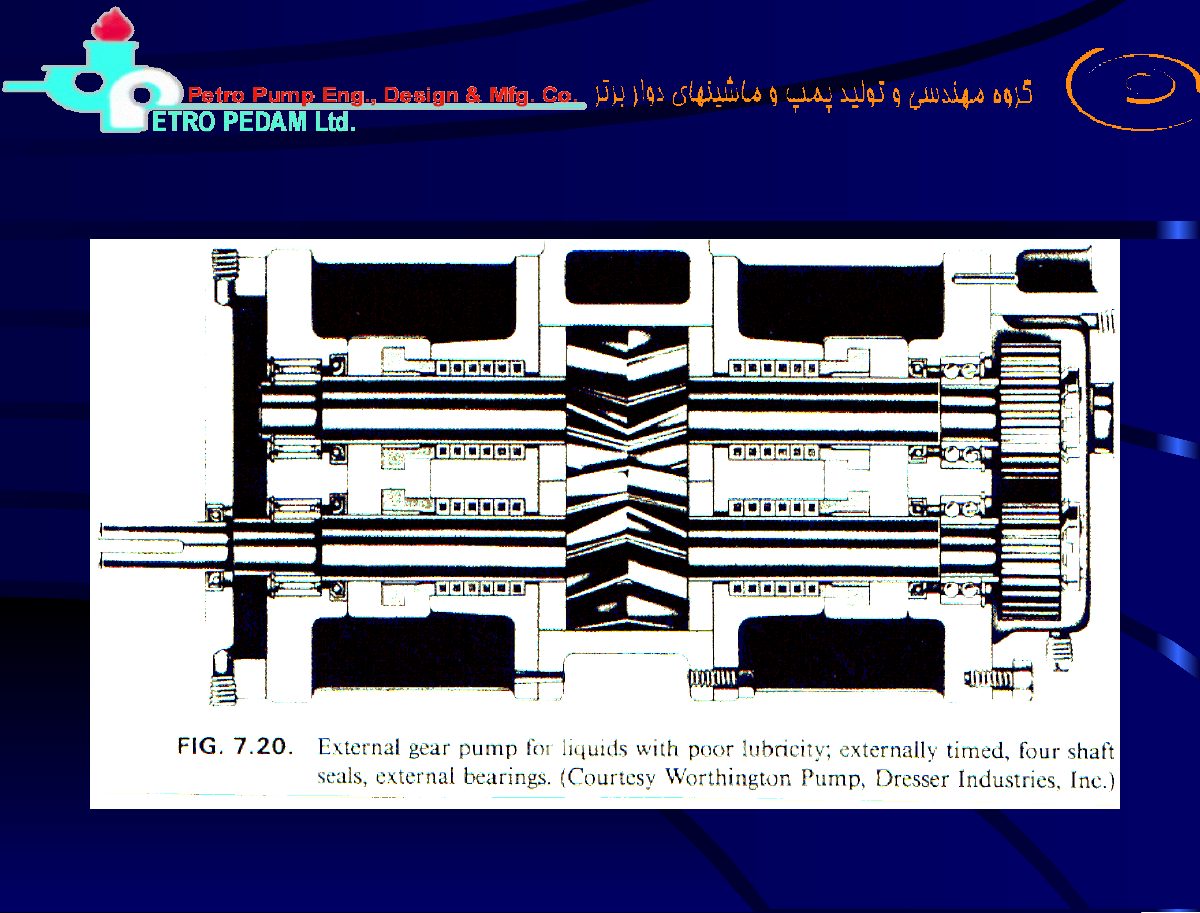
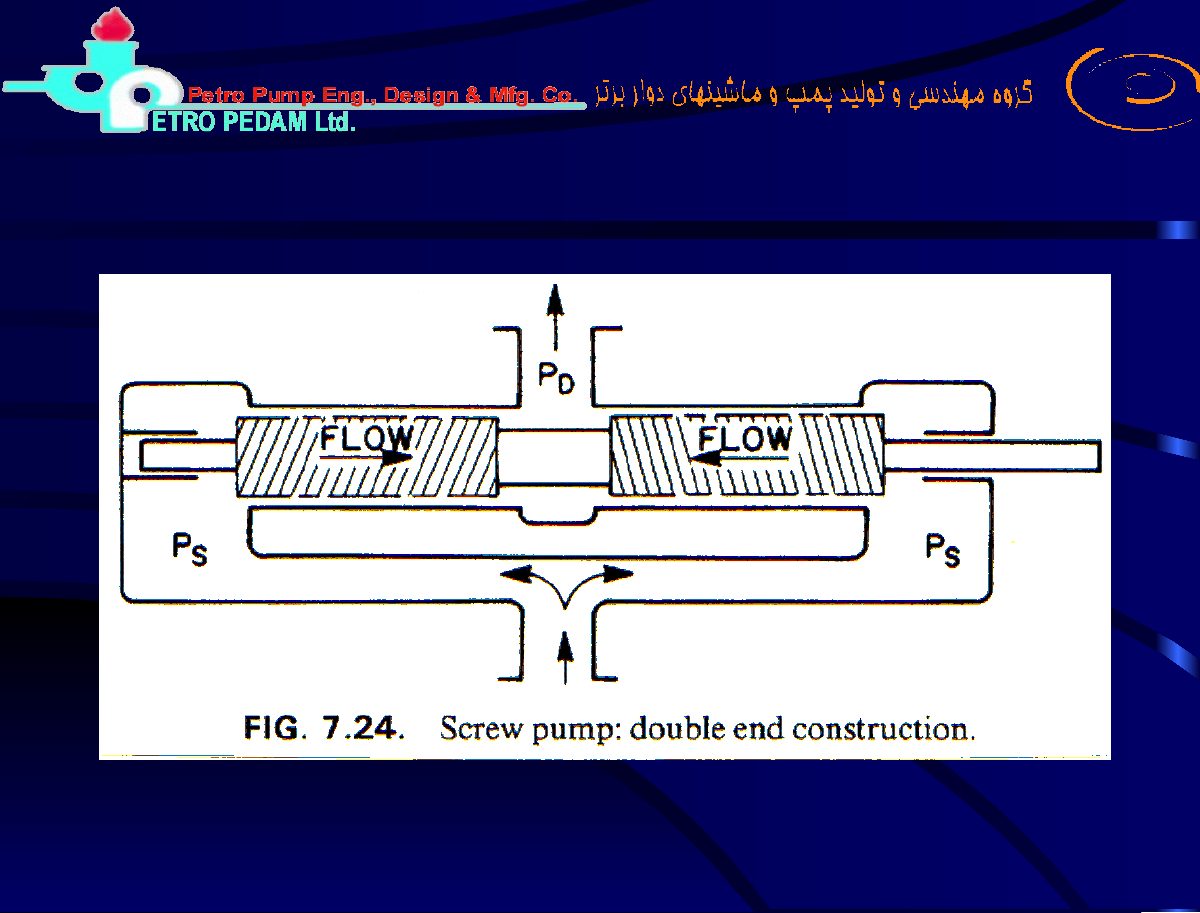
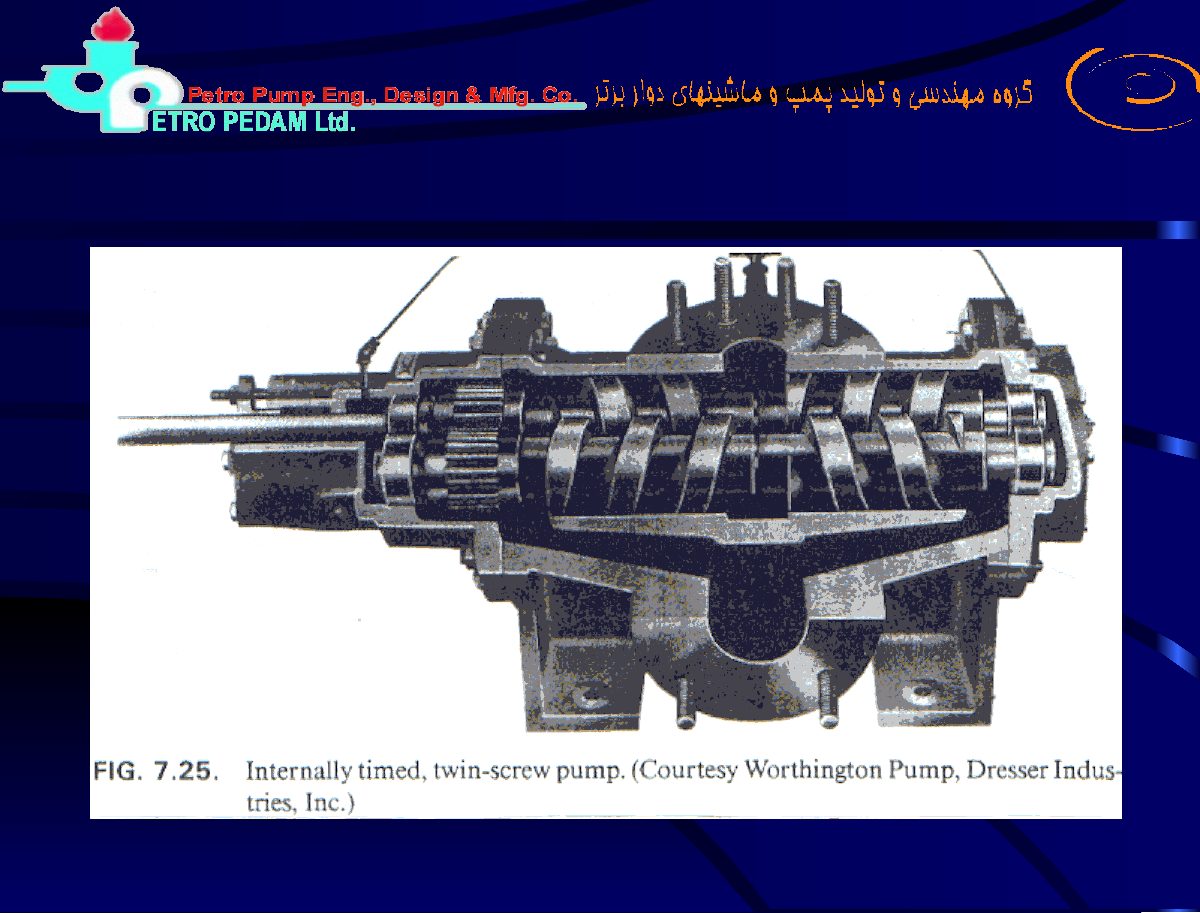
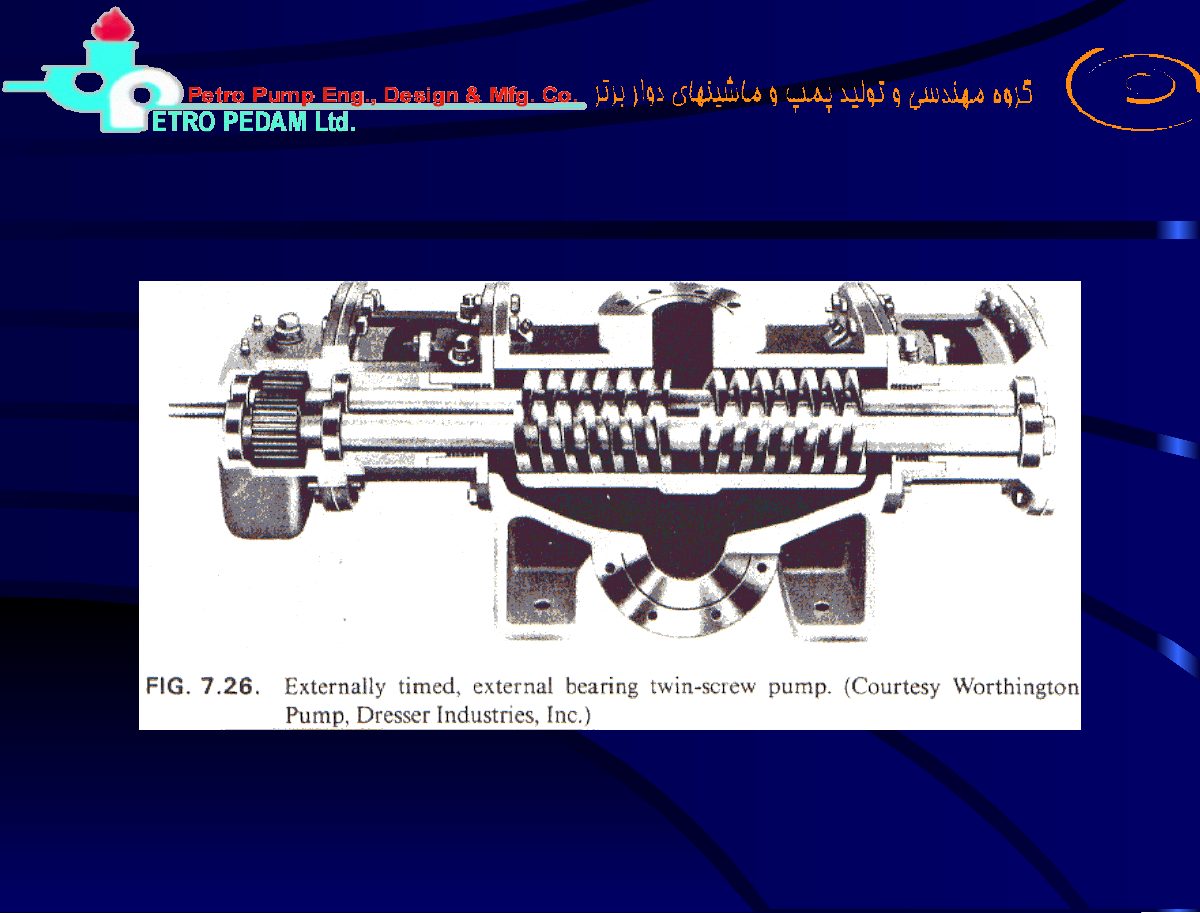
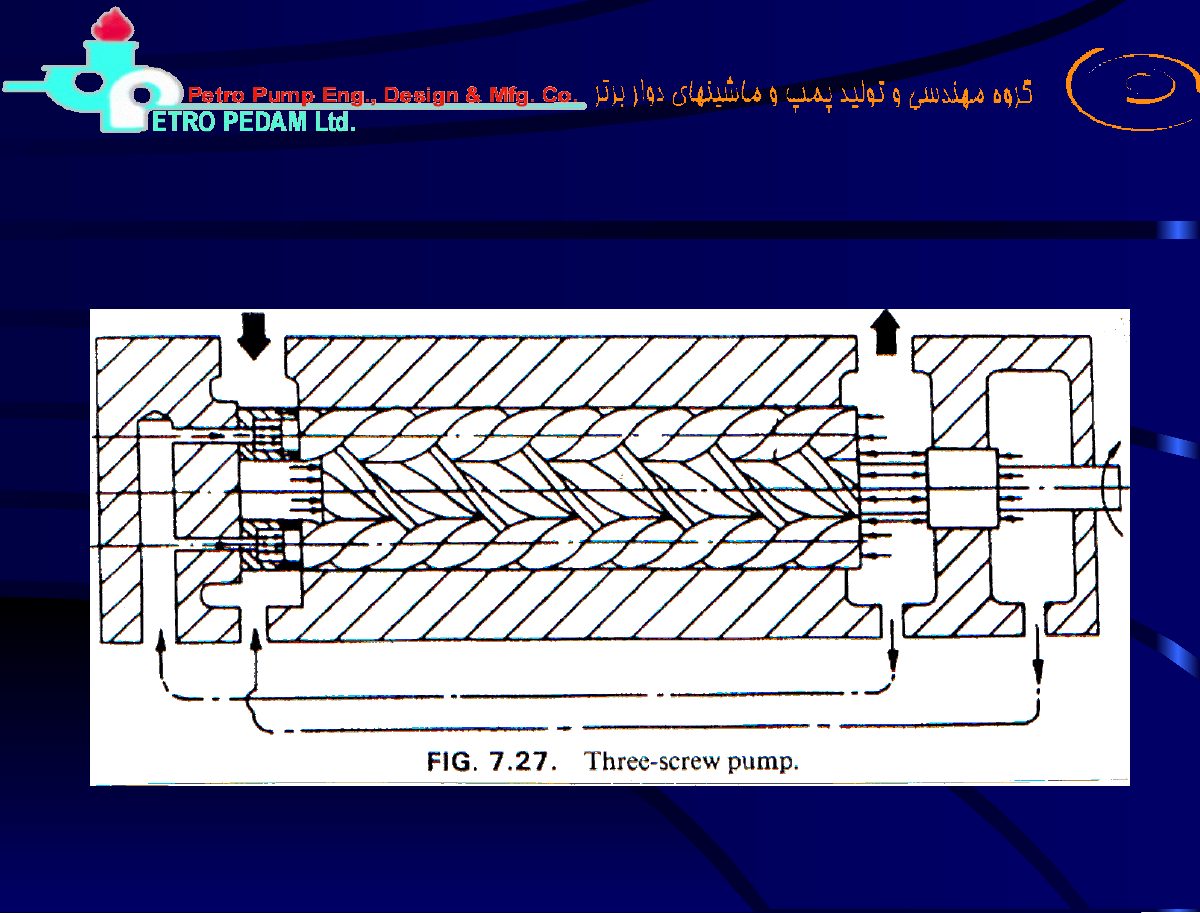
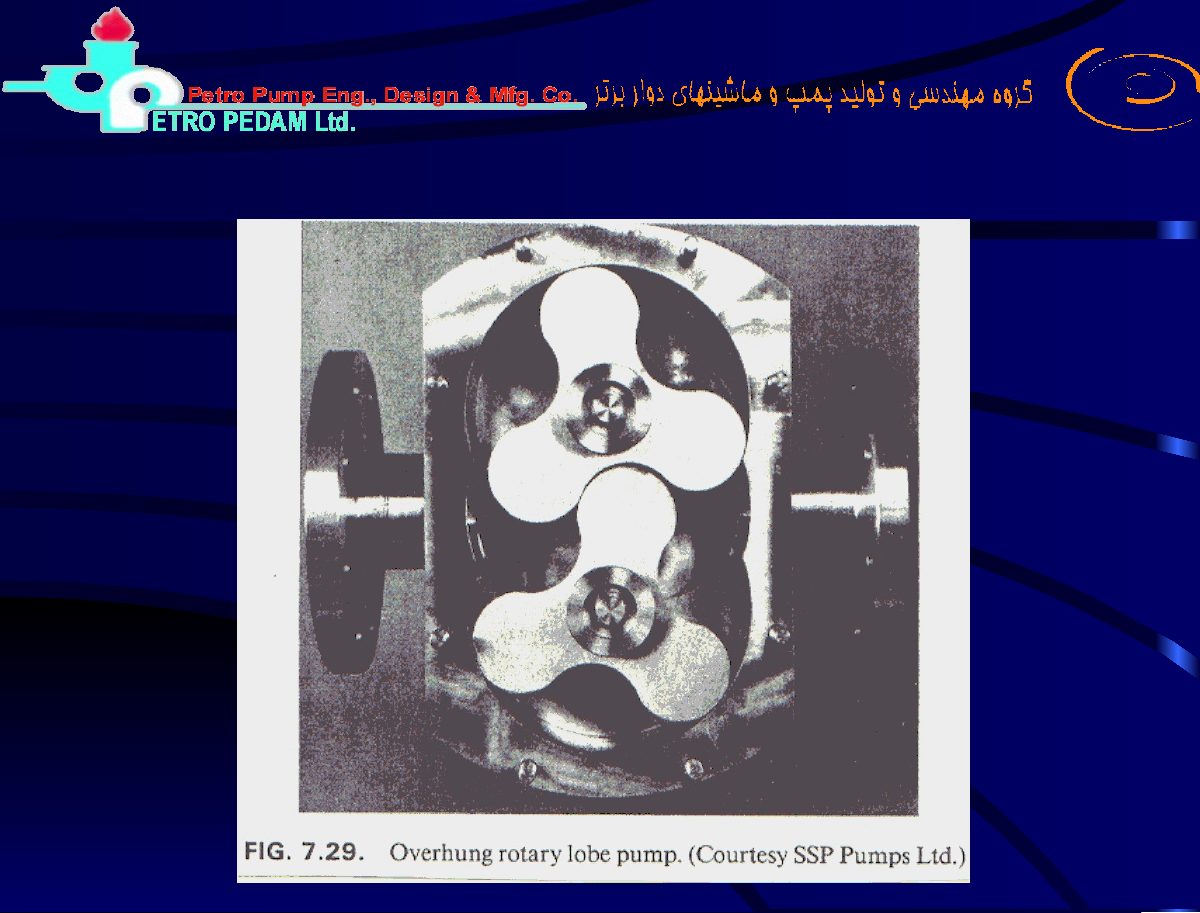
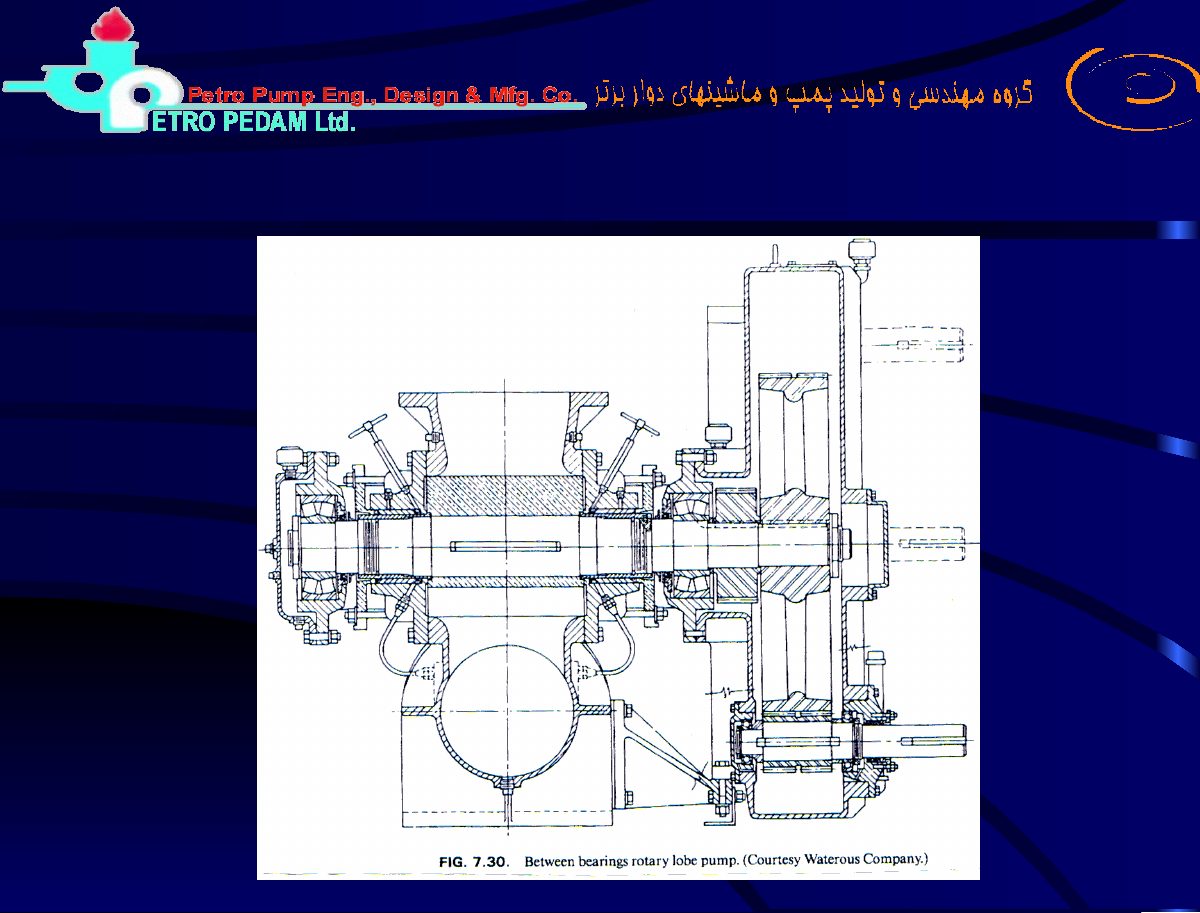
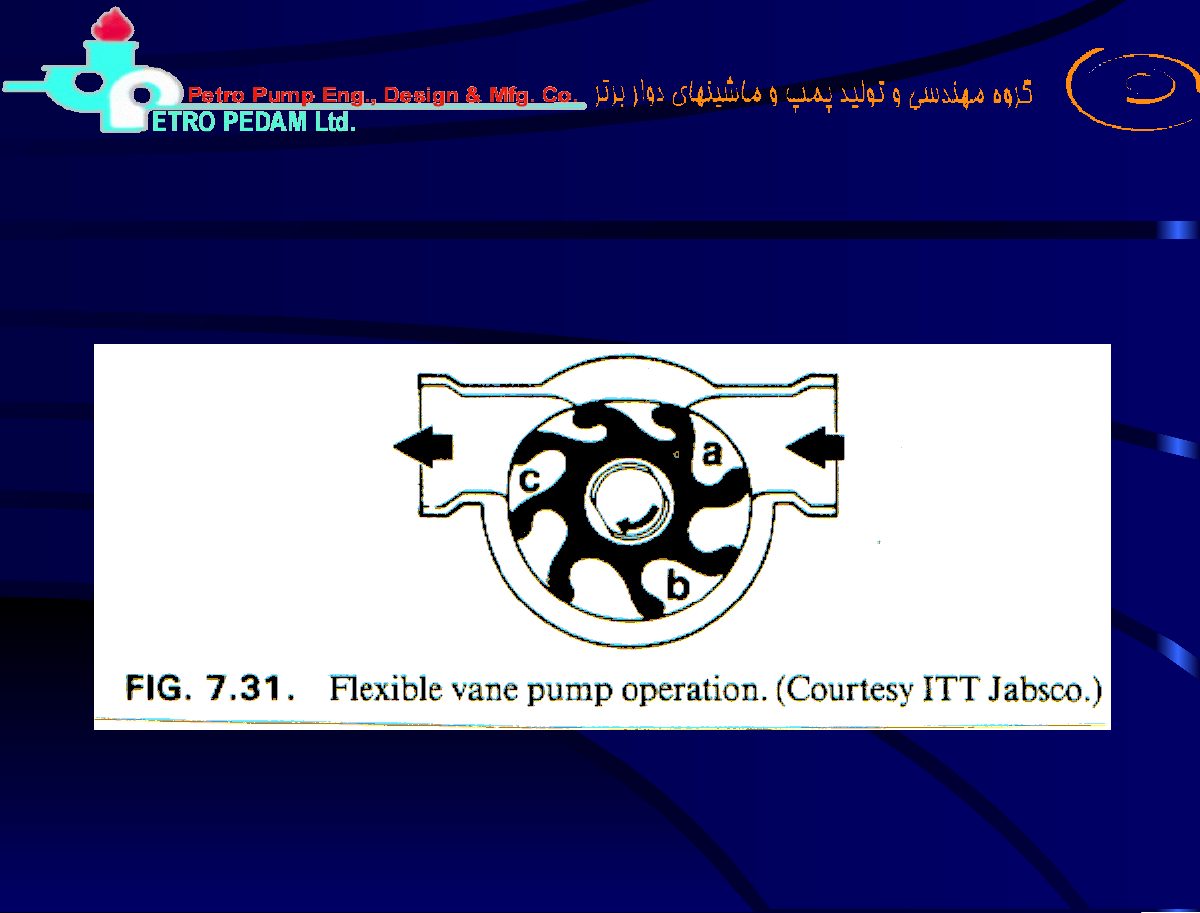
Original pages 145–156
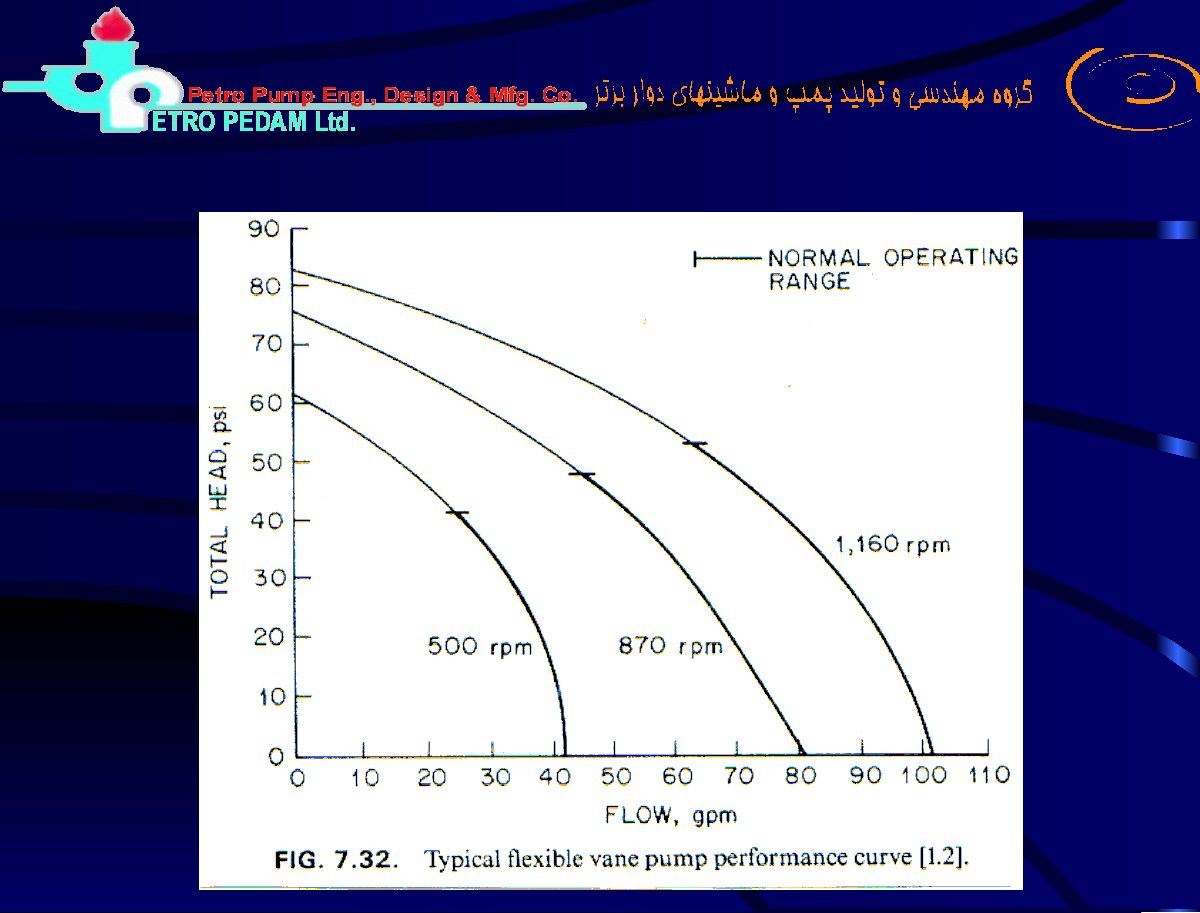
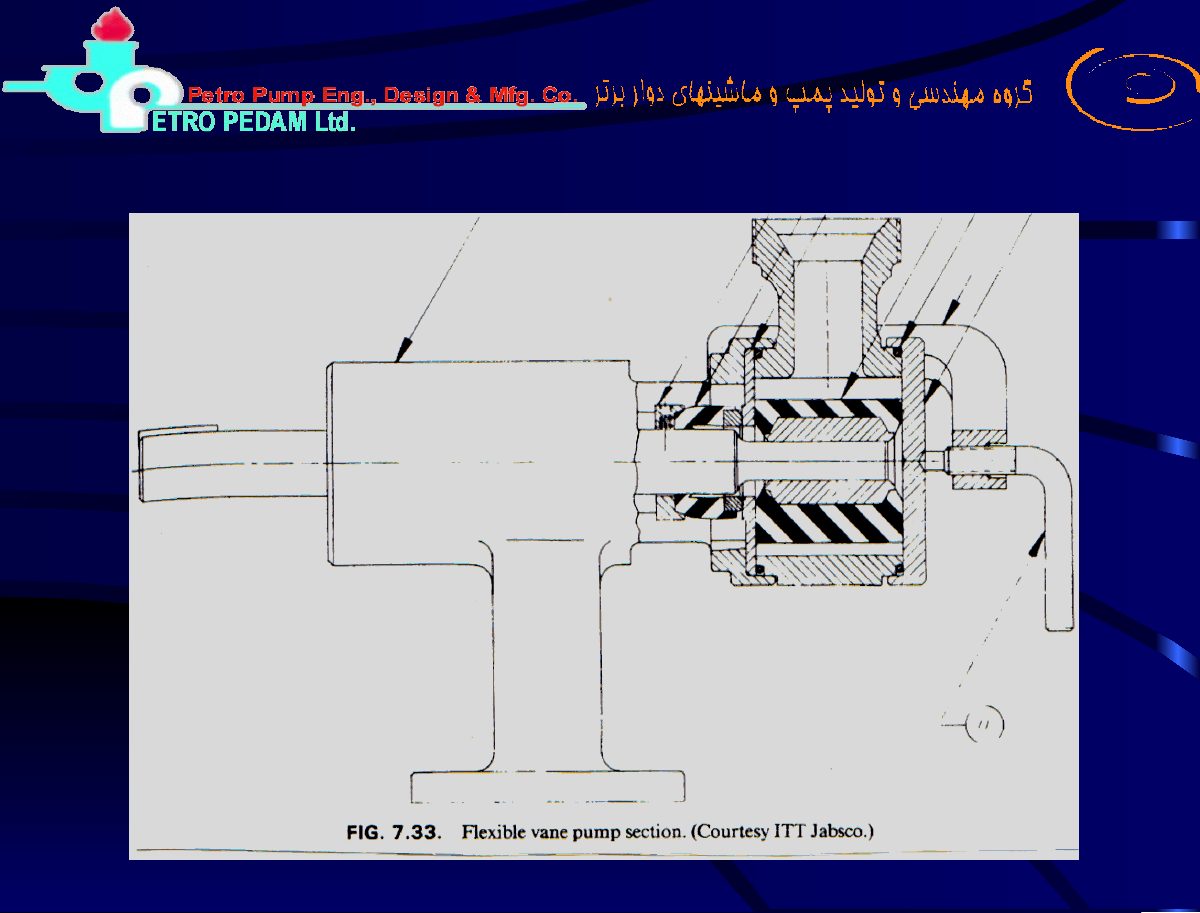
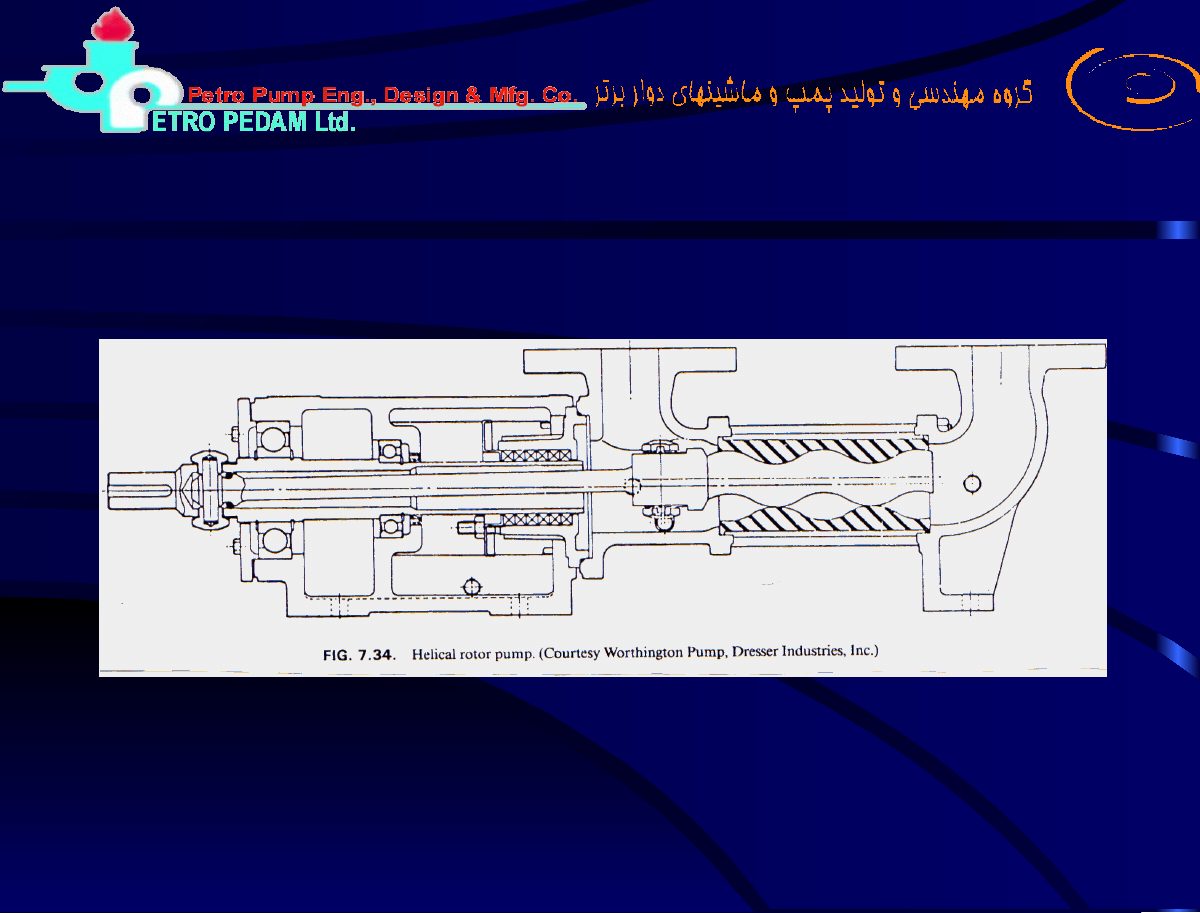
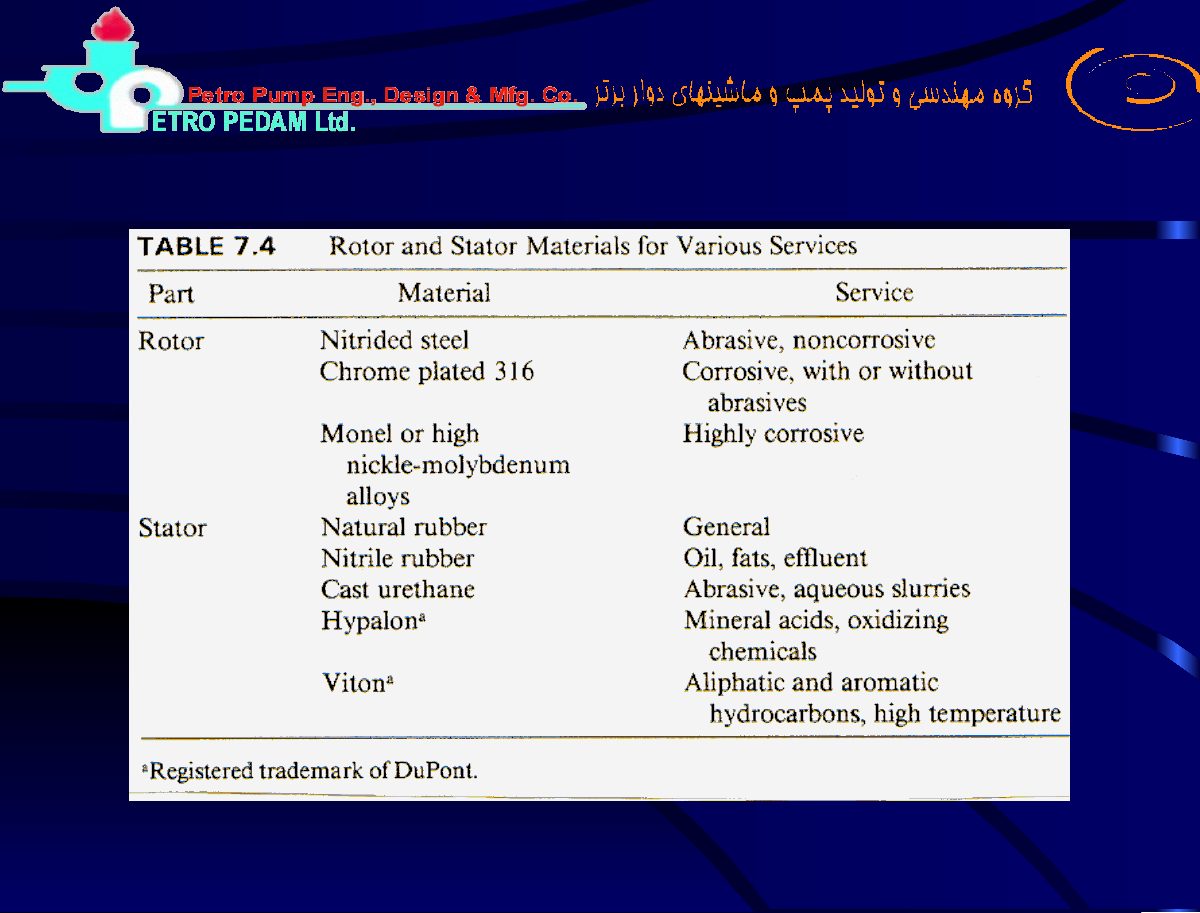
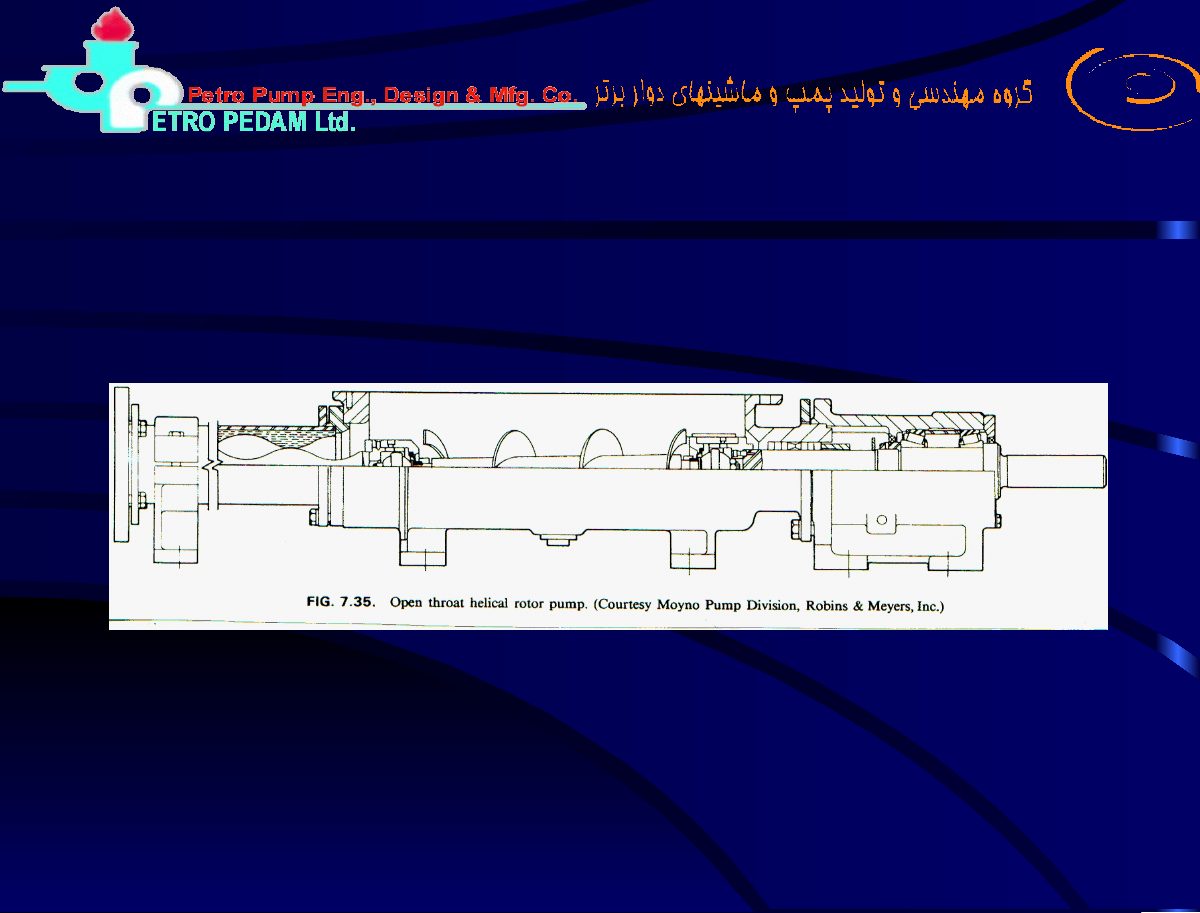
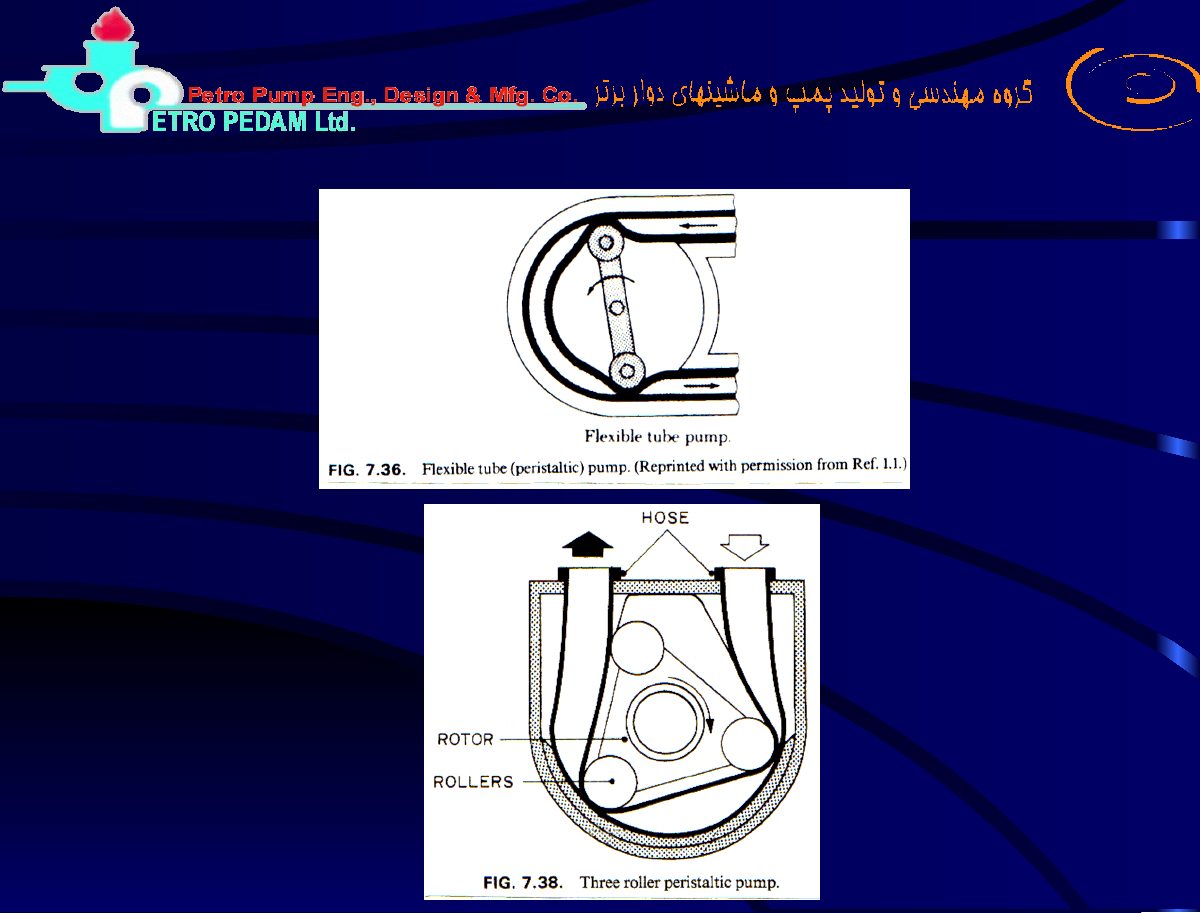
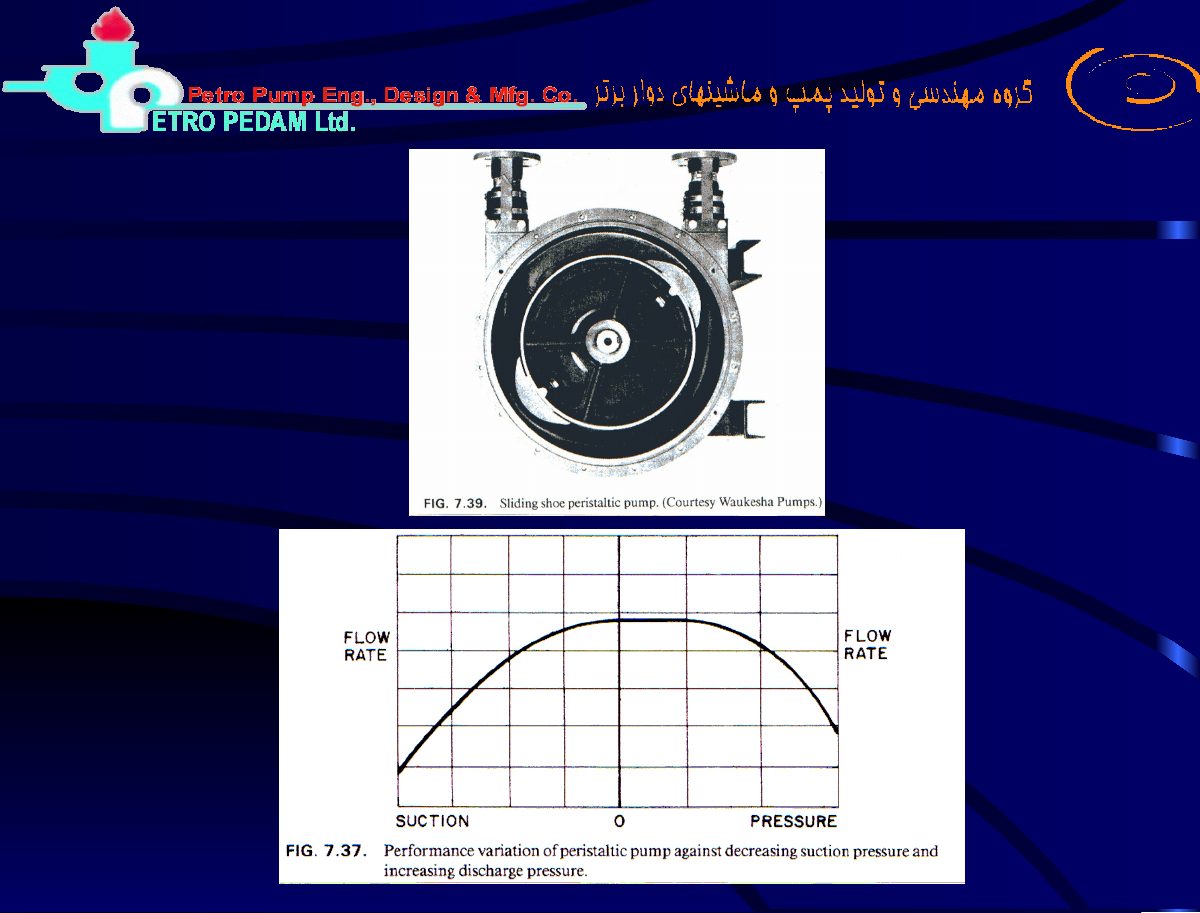
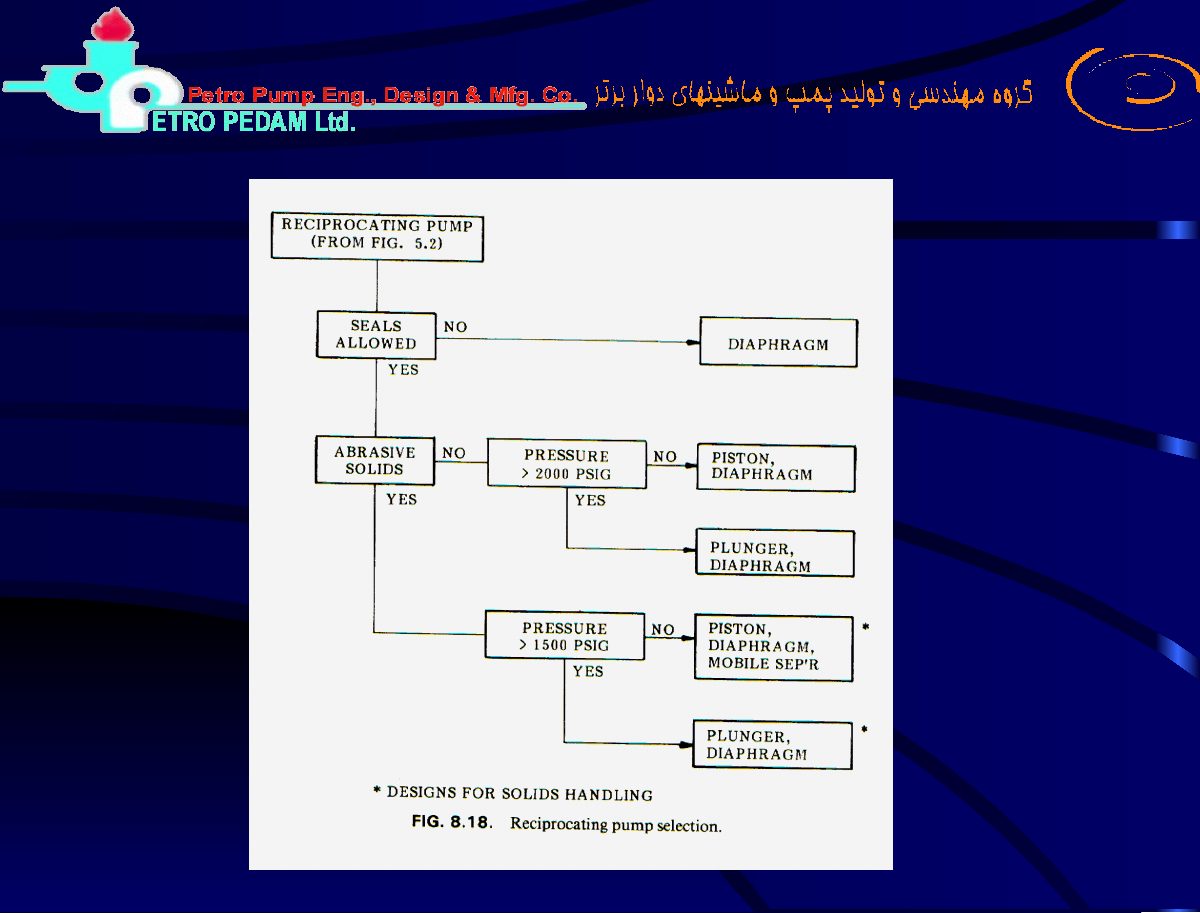
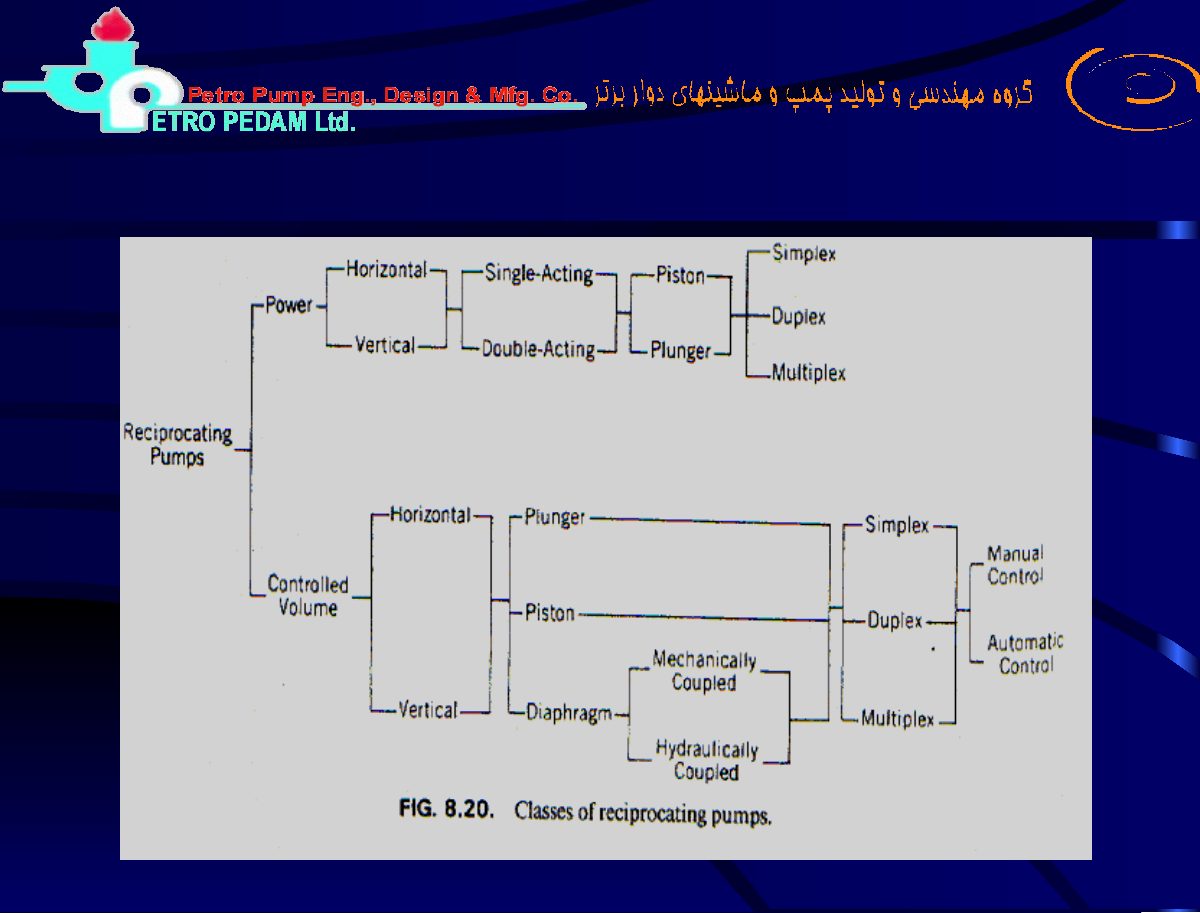
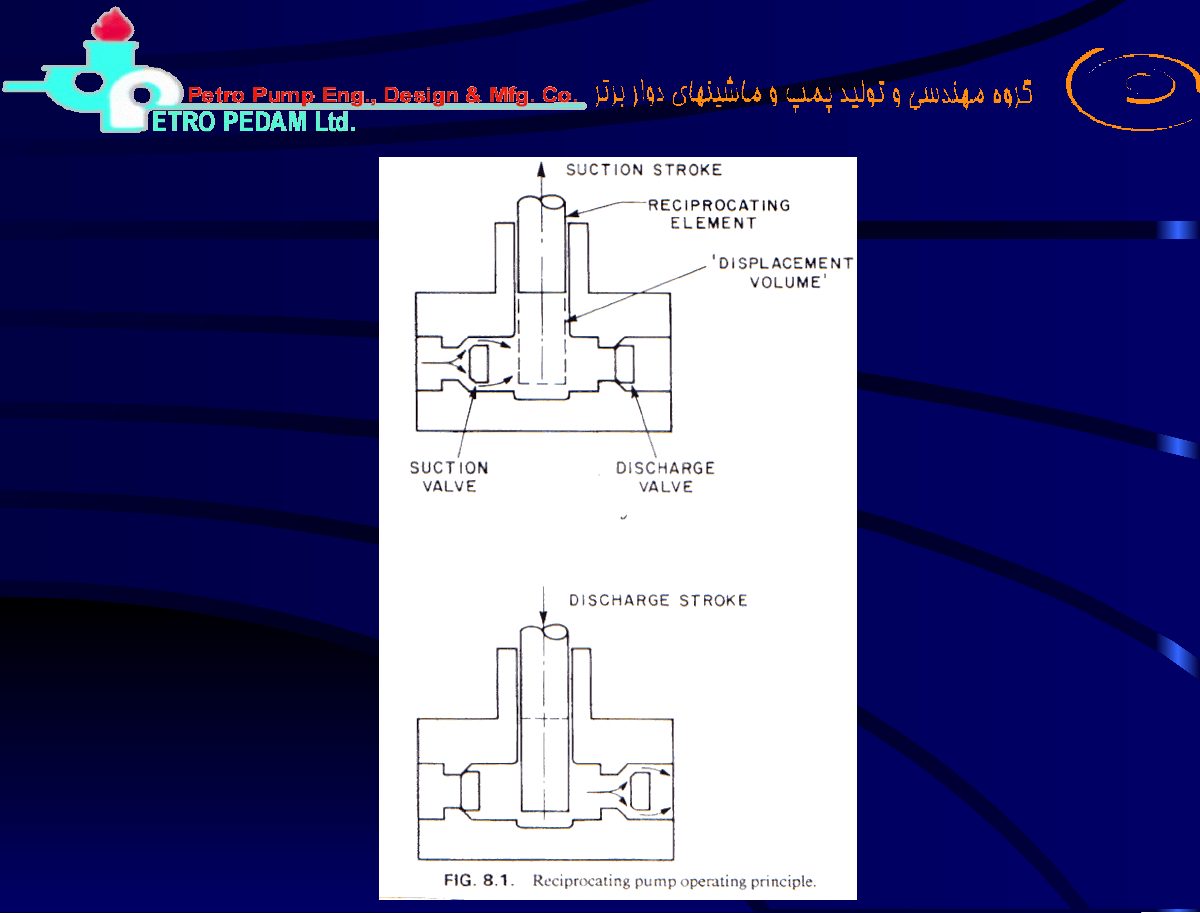
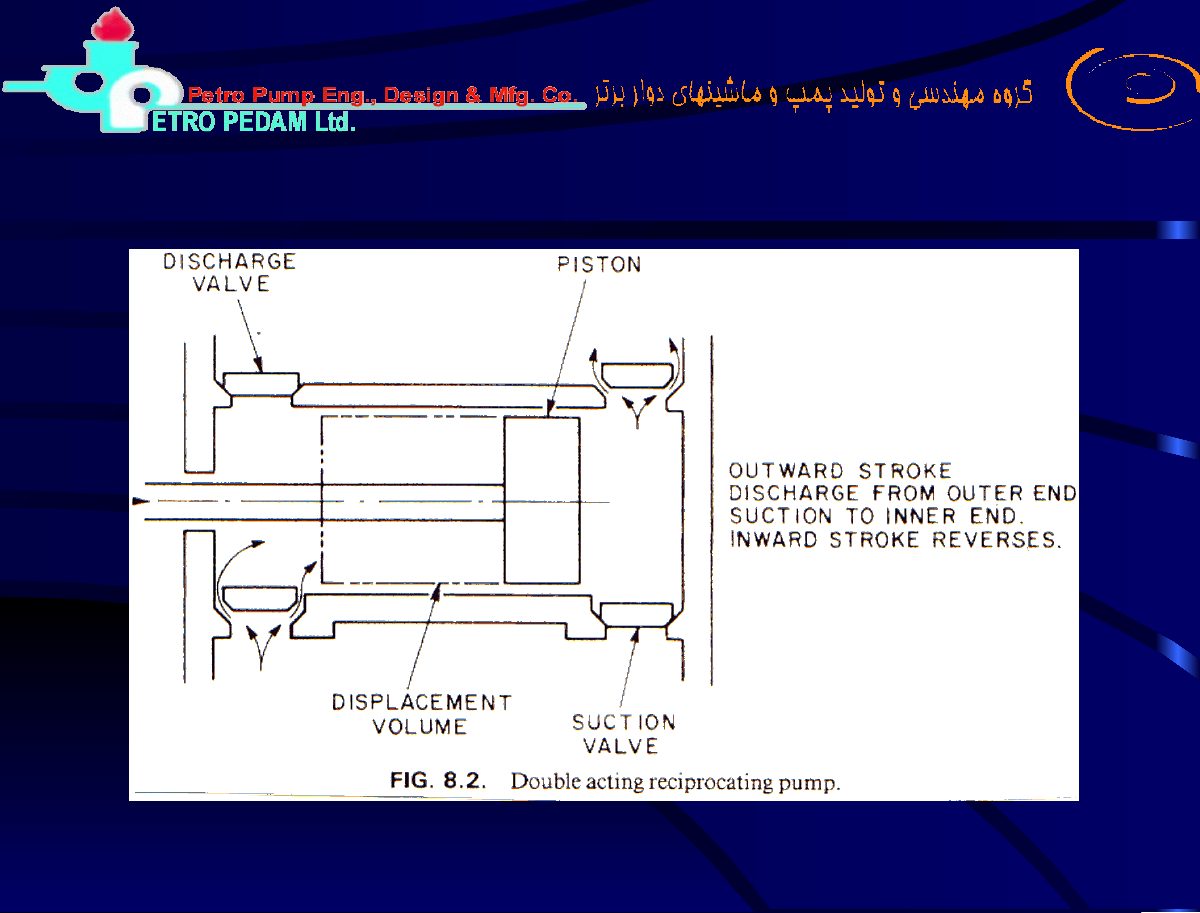
Original pages 157–166